18.3 Building and Using Phylogenetic Trees
Elizabeth Dahlhoff
Learning Objectives
By the end of this section, you will be able to do the following:
- Understand how phylogenetic trees are constructed.
- Explain how maximum parsimony is used to help construct evolutionary trees.
- Compare homologous and analogous traits (homoplasy).
- Understand applications of phylogenetic tools and constraints of those tools.
Introduction
Phylogeny is the study of the evolutionary relationships between organisms. Scientists often want to understand patterns and identify evolutionary trends. This can be accomplished by determining who is most closely related to whom. Scientists can look for clues of the relationship by looking at physical traits (phenotype), how embryos are developing, behaviors, and molecular data (such as DNA or proteins). Scientists must collect accurate information that allows them to make evolutionary connections among organisms and while this seems straightforward, it is sometimes very difficult. Sometimes species will look similar, but not be related. Other times DNA changes might not be detected properly and you can get a misleading understanding of the relationship. Similar to detective work, scientists must use evidence to uncover the facts. In the case of phylogeny, evolutionary investigations focus on two types of evidence: morphologic (form and function) and genetic.
Once scientists have these relationships established, they often show them in diagram form. The evolutionary tree is a hypothesis based on available information but may change as more data are collected. These evolutionary trees place organisms that are more closely related to one another closer together on the tree and those that are more distantly related further apart (Figure 18.3.1).
Why Does Phylogeny Matter?
Using such evolutionary trees can be helpful to understand the evolution of certain traits and when these traits evolved. They can also be used in more practical ways. For example, scientists have used such trees to help with conservation efforts, to predict what extinct species may have looked or behaved like, and whether an organism is a distant species, a hybrid, or a mislabeled unique species.
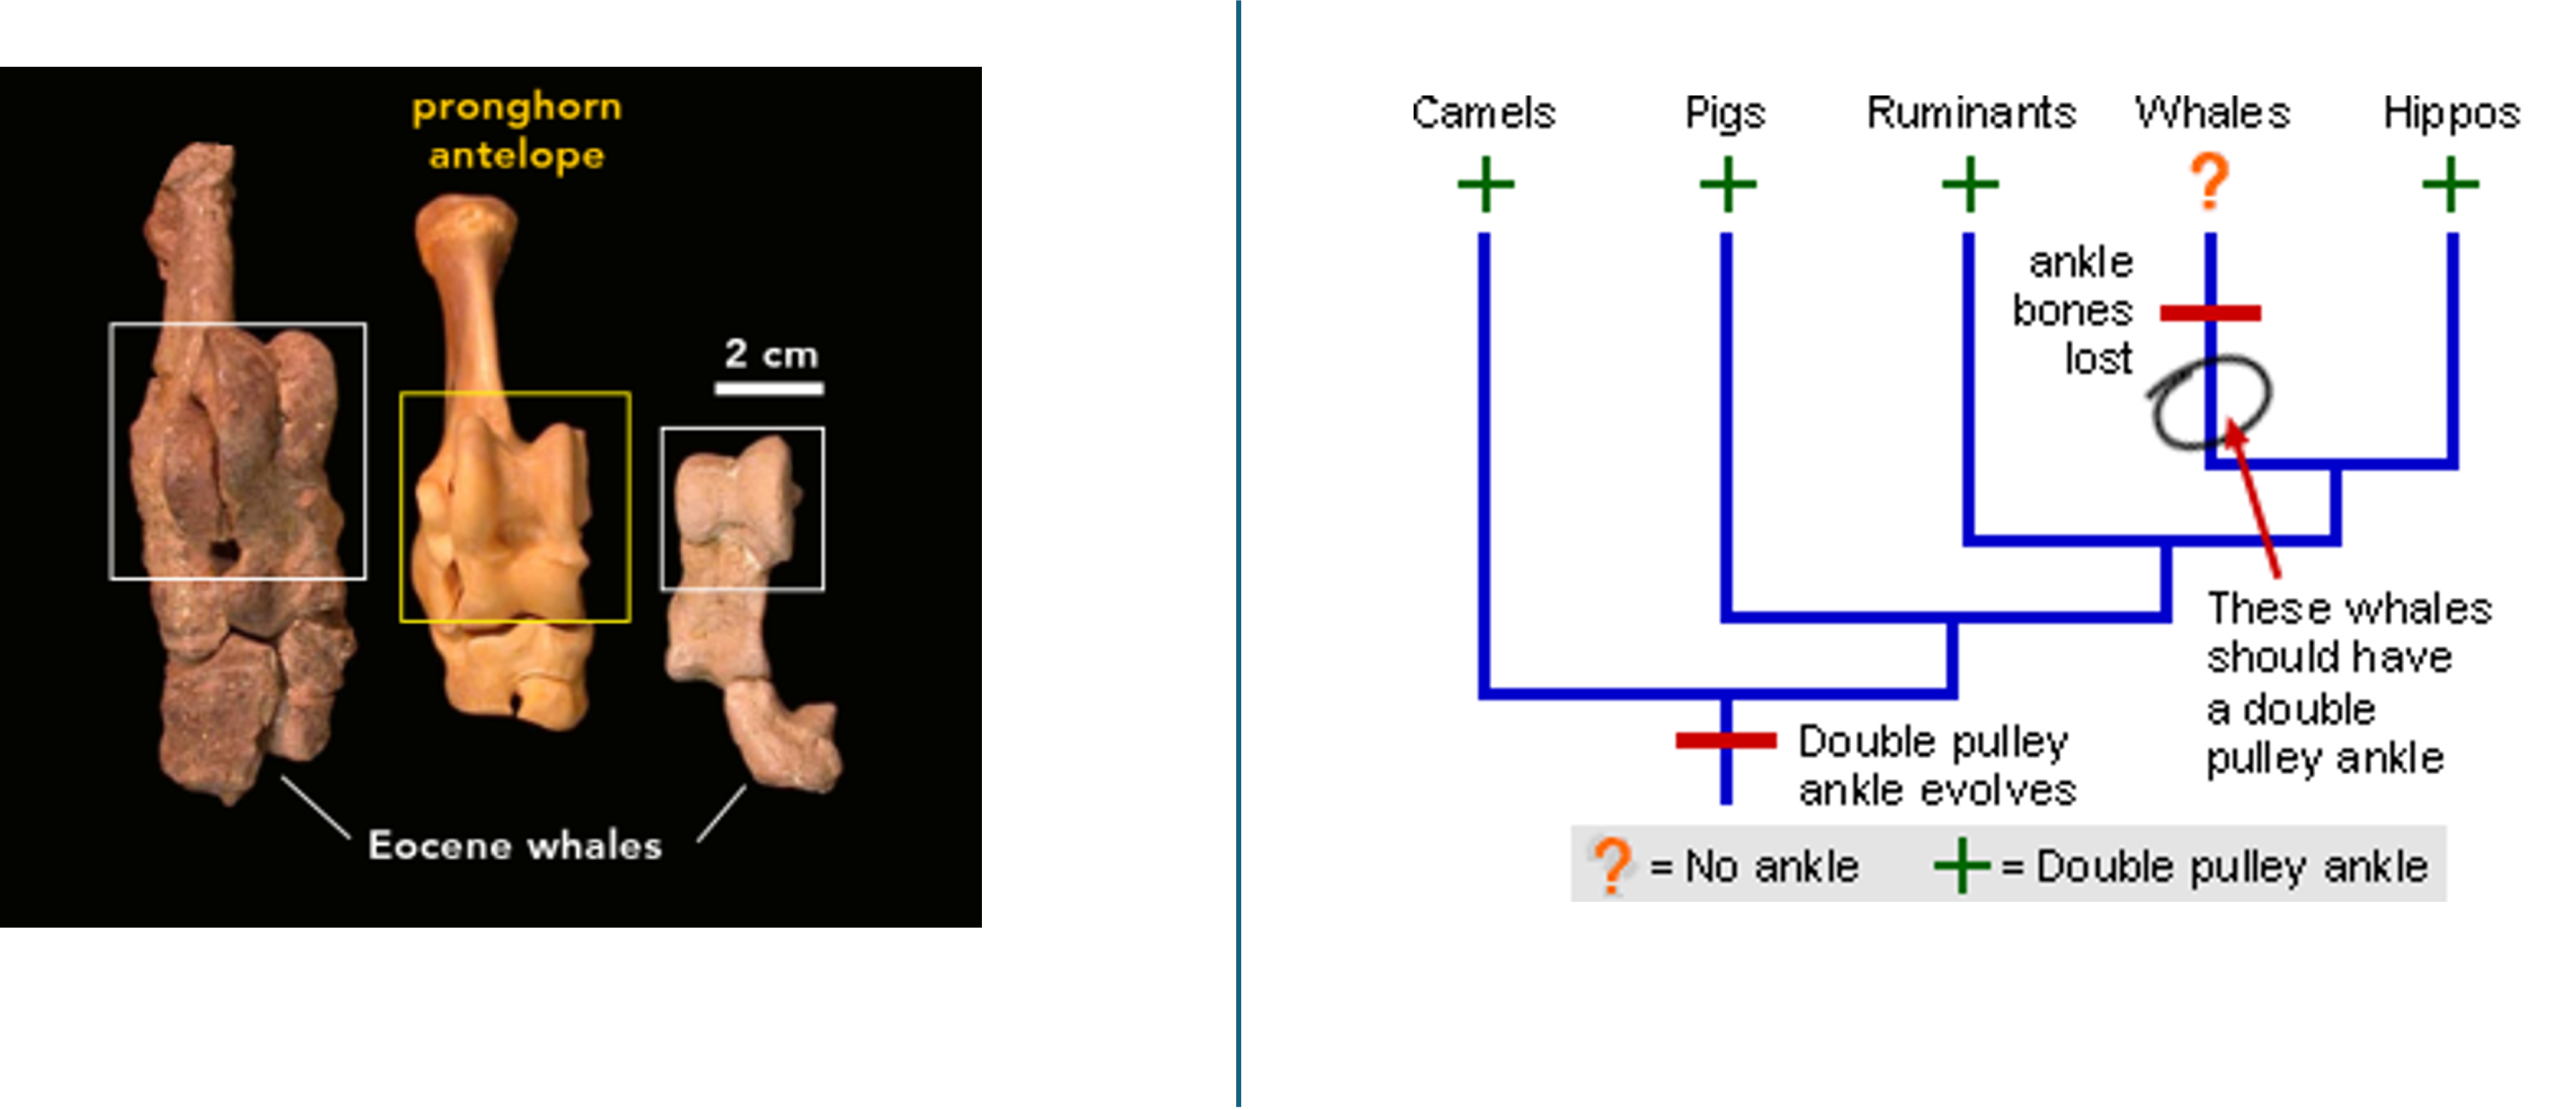
For example, scientists used to think that whales’ ancestors were now-extinct carnivores called mesonychids. However, based on recent findings, scientists have now hypothesized that whales are actually more closely related to hoofed mammals like hippos, cows and giraffes. This means we expect that ancient whales should share some characters with animals like hippos and cows. For examples, hippos have a unique type of ankle called a double pulley ankle. While modern whales do not have ankles at all (they have flippers), fossils show that ancient whales did have pelvises, hind legs, and double pulley ankles! Thus, we have morphological evidence that supports the hypothesis that whales are more closely related to hippos than they are to modern carnivores (like bears).
Traits to Help Distinguish Relationships
In general, organisms that share similar phenotype (physical features) and genomes (the totality of DNA found in the cells of organisms) are more closely related than those that do not. The more traits organisms share, the more closely related they are assumed to be. We refer to features that overlap morphologically (physical form) and also genetically based on coming from a common ancestor as homologous structures. They stem from developmental similarities passed down from a common ancestor over evolutionary time. For example, the bones in bat and bird wings have homologous structures (Figure 18.3.3).
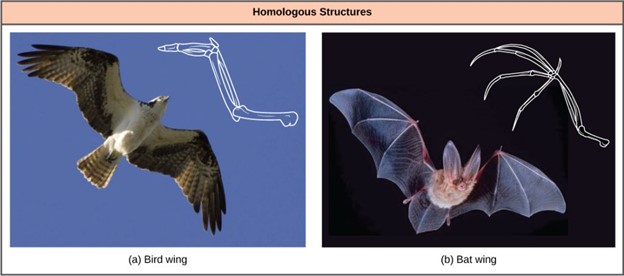
Notice it is not simply a single bone, but rather a grouping of several bones arranged similarly. The more complex the feature, the more likely any kind of overlap is due to a common evolutionary past. Imagine two people from different countries both inventing a car with all the same parts and in the same arrangement without any previous or shared knowledge. That outcome would be highly improbable. If two people, however, both invented a hammer, we can reasonably conclude that both could have the original idea without the help of the other. The same relationship between complexity and shared evolutionary history is true for homologous structures in organisms.
Misleading Appearances
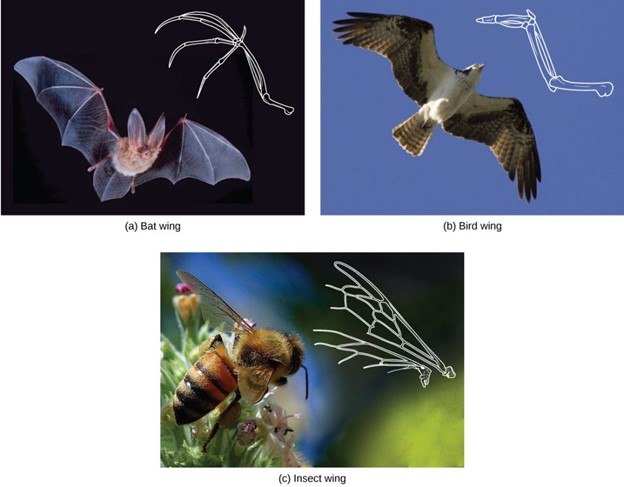
Some organisms may be very closely related, even though a minor genetic change caused a major morphological difference to make them look quite different. Similarly, unrelated organisms may be distantly related, but appear alike. This usually happens because both organisms have common adaptations that evolved within similar environmental conditions or similar selective pressures. When similar characteristics occur because of environmental constraints and not due to a close evolutionary relationship, it is an analogy or homoplasy. For example, insects use wings to fly like bats and birds, but the wing structure and embryonic origin are completely different. These shared features are thus analogous structures (Figure 18.3.4).
Similar traits can be either homologous or analogous (homoplastic). Homologous structures share a similar embryonic origin and stem from a common evolutionary ancestor. Analogous (homoplastic) organs have a similar function but are not derived from a common ancestor. For example, the bones in a whale’s front flipper are homologous to the bones in the human arm. They stem from a common ancestor; these structures are homologous.
A butterfly or bird’s wings are analogous but not homologous. As such, over time, the shape of these animals’ wings began to look and function alike due to the environmental constraints of flight. To reduce drag and increase lift, the form of wings evolved. The wings of birds and butterflies look alike due to these selective pressures, not due to a common ancestor. The wings are analogous to each other.
The UC Museum of Paleontology webpage on “Misinterpretations About Relatedness” has several examples to show how appearances can be misleading in understanding the phylogenetic relationships of organisms.
Constructing Evolutionary Trees
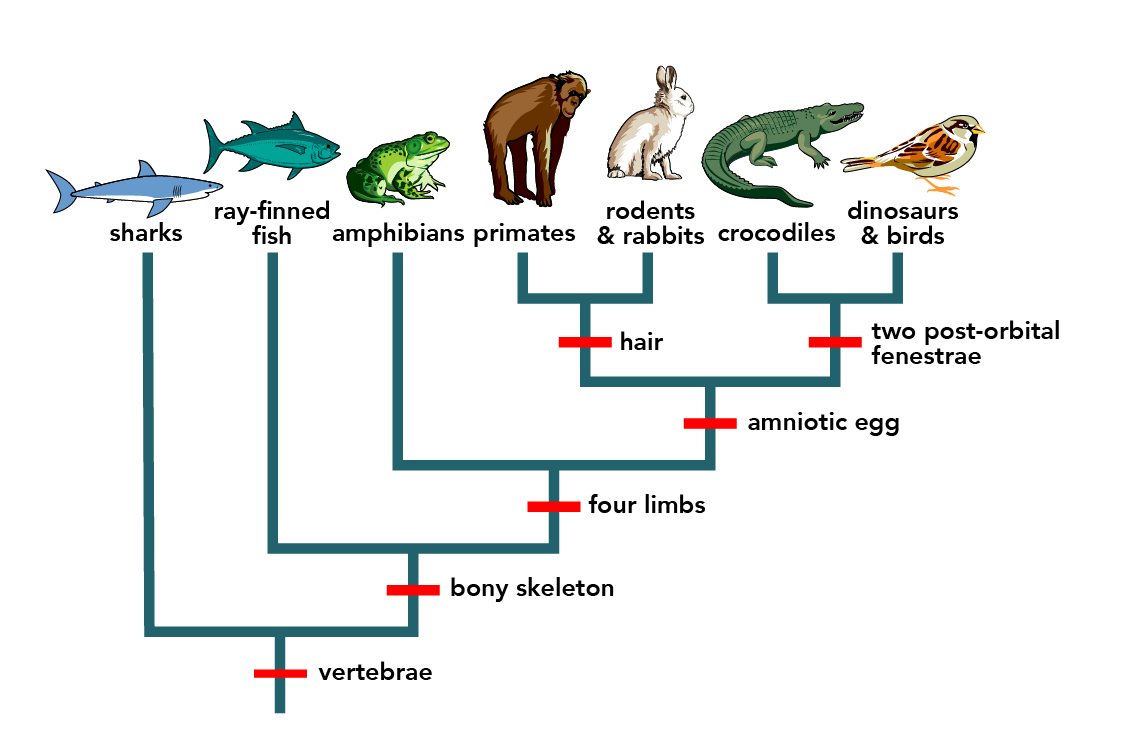
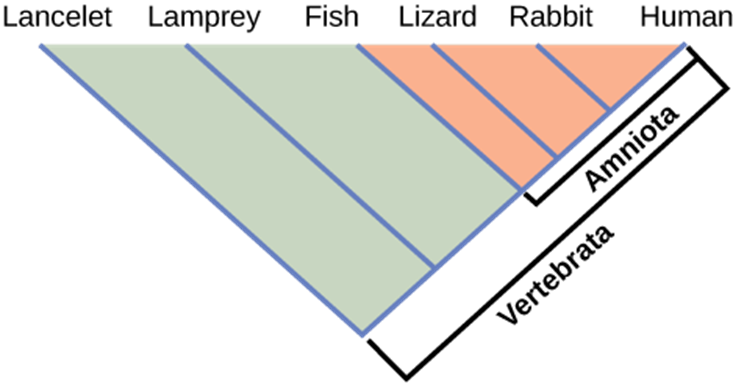
How do scientists construct phylogenetic trees from molecular or morphological data? After they sort the homologous and analogous traits, which could be DNA sequences or physical phenotypes (or both), scientists often organize the homologous traits using cladistics. This system sorts organisms into clades: groups of organisms that descended from a single ancestor. In cladistics, scientists often use molecular data to understand relationships, but they may also use the physical traits they can see as well. For example, in Figure 18.3.5, all the organisms in the orange region evolved from a single ancestor that had amniotic eggs. Amniotic eggs are an adaptation to life on land. These eggs contain different components to help the embryo deal with developing in an egg that is laid on land, rather than in the water. These eggs contain an amnion, which is a fluid that surrounds the embryo and protects it while it grows. The eggs also contain yolk to help nourish the developing embryo, a chorion to help with gas exchange and an allantois sac to hold waste. Consequently, these organisms with amniotic eggs make a single clade or a monophyletic group. Clades must include all descendants from a branch point.
The monophyletic group is the “ideal” type of cladogram because it will contain the ancestor and every single descendant species. There are no missing species and no gaps. Every piece of the puzzle is present.
Clades can vary in size depending on which branch point one references. The important factor is that all organisms in the clade or monophyletic group stem from a single point on the tree. You can remember this because monophyletic breaks down into “mono,” meaning one, and “phyletic,” meaning evolutionary relationship.
For a great primer on what is and isn’t a true clade, check out UC Museum of Paleontology’s webpage on “Clades Within Clades.”
History of Life on Earth
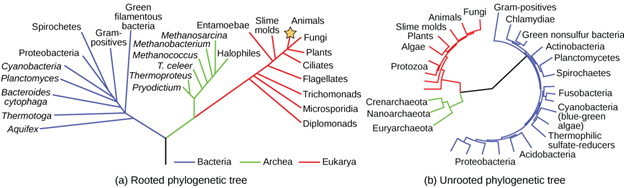
A phylogenetic tree can be read like a map of evolutionary history. Many phylogenetic trees have a single lineage at the base representing a common ancestor. Scientists call such trees rooted, which means there is a single ancestral lineage (typically drawn from the bottom or left) to which all organisms represented in the diagram relate. Notice in the rooted phylogenetic tree that the three domains—Bacteria, Archaea, and Eukarya—diverge from a single point and branch off. The small branch that plants and animals (including humans) occupy in this diagram shows how recent and minuscule these groups are compared with other organisms. Unrooted trees don’t show a common ancestor but do show relationships among species (Figure 18.3.6).
The diagrams above can serve as a pathway to understanding evolutionary history. The pathway can be traced from the origin of life to any individual species by navigating through the evolutionary branches between the two points. Also, by starting with a single species and tracing back towards the “trunk” of the tree, one can discover that species’ ancestors, as well as where lineages share a common ancestry. In addition, the tree can be used to study entire groups of organisms.
Another point to mention on phylogenetic tree structure is that rotation at branch points does not change the information. For example, if a branch point was rotated and the taxon order changed, this would not alter the information because the evolution of each taxon from the branch point was independent of the other.
Many disciplines within the study of biology contribute to understanding how past and present life evolved; these disciplines together contribute to building, updating, and maintaining the “tree of life.” Information is used to organize and classify organisms based on evolutionary relationships in a scientific field called systematics. Data may be collected from fossils, from studying the structure of body parts or molecules used by an organism, and by DNA analysis. By combining data from many sources, scientists can put together the phylogeny of an organism; since phylogenetic trees are hypotheses, they will continue to change as new types of life are discovered and new information is learned.
Shared Characteristics
Organisms evolve from common ancestors and then diversify. Scientists use the phrase “descent with modification” because even though related organisms have many of the same characteristics and genetic codes, changes occur. This pattern repeats as one goes through the phylogenetic tree of life:
- A change in an organism’s genetic makeup leads to a new trait that becomes prevalent in the group.
- Many organisms descend from this point and have this trait.
- New variations continue to arise: some are adaptive and persist, leading to new traits.
- With new traits, a new branch point is determined (go back to step 1 and repeat).
If a characteristic is found in the ancestor of a group, it is considered a shared ancestral character because all of the organisms in the taxon or clade have that trait. The vertebrate in Figure 18.3.5 is a shared ancestral character. Now consider the amniotic egg characteristic in the same figure. Only some of the organisms in Figure 18.3.5 have this trait, and to those that do, it is called a shared derived character because this trait is derived at some point but does not include all of the ancestors in the tree.
Derived traits are sometimes called advanced traits. The reference is to time, not complexity. Therefore, advanced traits are younger traits compared to older, primitive traits. Again, primitive does not mean simple, instead primitive is about time. Primitive traits have been around for a long evolutionary time and are sometimes called ancestral traits. We find these traits associated with ancestor species.
Limitations of Phylogenetic Trees
It may be easy to assume that more closely related organisms look more alike, and while this is often the case, it is not always true. If two closely related lineages evolved under significantly varied surroundings or after the evolution of a major new adaptation, the two groups can appear more different than other groups that are not as closely related. For example, the phylogenetic tree in Figure 18.3.7 shows that lizards and rabbits both have amniotic eggs, whereas frogs do not; yet lizards and frogs appear more similar than lizards and rabbits.
Another aspect of phylogenetic trees is that, unless otherwise indicated, the branches do not account for length of time, only the evolutionary order. In other words, the length of a branch does not typically mean more time passed, nor does a short branch mean less time passed—unless specified on the diagram. For example, in Figure 18.3.7, the tree does not indicate how much time passed between the evolution of amniotic eggs and hair. What the tree does show is the order in which things took place. Again, using Figure 18.3.7 above, the tree shows that the oldest trait is the vertebral column, followed by hinged jaws, and so forth. Remember that any phylogenetic tree is a part of the greater whole, and like a real tree, it does not grow in only one direction after a new branch develops. So, for the organisms in Figure 18.3.7, just because a vertebral column evolved does not mean that invertebrate evolution ceased, it only means that a new branch formed. Also, groups that are not closely related, but evolve under similar conditions, may appear more phenotypically similar to each other than to a close relative.
Choosing the Right Relationships
Organizing the evolutionary relationships of all life on Earth proves difficult: scientists must span enormous blocks of time and work with information from long-extinct organisms. Trying to decipher the proper connections, especially given the presence of homologies and analogies, makes the task of building an accurate tree of life extraordinarily difficult. Add to that advancing DNA technology, which now provides large quantities of genetic sequences for researchers to use and analyze. Taxonomy, the branch of science concerned with the classification of organisms, is a subjective discipline in some ways: many organisms have more than one connection to each other, so each taxonomist will decide the order of connections. These relationships can change as more data are gathered and technology changes to highlight previously unknown information.
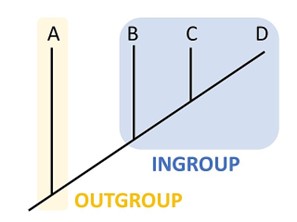
To help build an evolutionary tree, scientists will use an outgroup species as a reference group. The outgroup consists of a species that is related to the species being studying, but not too closely related (Figure 18.3.8). For example, if you are studying several species that are amniotes, you could use an amphibian as an outgroup. This species is a vertebrate and has connections to land (so there is some relation there, but does not lay amniotic eggs). Scientists would use this species as the outgroup and reference it as the oldest. From there we could compare the other species to and decide how closely or distantly related it is to the outgroup. This will help determine placement on the cladogram.
To aid in the tremendous task of describing phylogenies accurately, scientists often use the concept of maximum parsimony, which means that events occur in the simplest, most obvious way. For example, if a group of people entered a forest preserve to hike, based on the principle of maximum parsimony, one could predict that most would hike on the established trail that had the most direct route to the waterfall (end goal) rather than creating new paths in the forest or moving from one path to another before getting to the waterfall. This would take more energy and the complexity would not be favored. The idea with maximum parsimony is to “go with the most simple explanation.” That relationship description will represent the most probable hypothesis.
For scientists deciphering evolutionary pathways, the pathway of evolution probably includes the fewest major events that coincide with the evidence at hand. Starting with all of the homologous traits in a group of organisms, scientists look for the most obvious and simple order of evolutionary events that led to the occurrence of those traits.
To learn more about how researchers use maximum parsimony to create phylogenetic trees, visit UC Museum of Paleontology’s webpage on “Using Parsimony.”
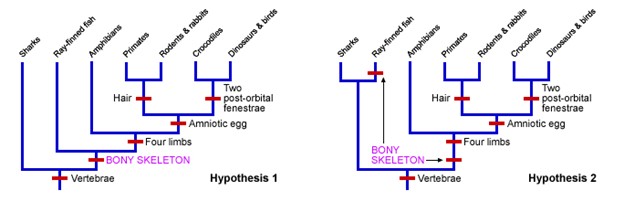
In the following example, notice two evolutionary trees were created, representing Hypothesis 1 and Hypothesis 2 (Figure 18.3.9). Notice that Hypothesis 1 shows six novel changes indicated by the red bars. Hypothesis 2 shows seven changes. Based on maximum parsimony, the better hypothesis to describe the relationship between these species would be Hypothesis 1.
Potential Problems and Confusion with Cladograms
As discussed above, the goal is to find the ancestor and all the descendants (monophyletic clade) with the most simple pathway (parsimony). The traits that all the descendants share would be homologous, coming from that ancestor. In cladistics, you might hear the term synapomorphy to describe a derived character shared by members of a clade. These traits and the monophyletic grouping are the goals when building cladograms. You may also hear the term plesiomorphy, which is a primitive trait that has stuck around over evolutionary time and you see it with all the members of the clade. The ancestor had the traits and all the descendants do too. Plesiomophies do not change over evolutionary time, but the synapomorphies have changed from the ancestor.
If a scientist mistakes a trait as homologous when it is actually analogous, they will get the wrong “answer” and make a mistake about who is closely related to whom. Remember these analogous traits come from the same selective pressure in the environment, not from the same ancestor. Another way of stating this is to say that convergent evolution carved out the analogous traits. Convergent evolution is the independent development of similar structures in organisms that are not directly related but are found instead due to similar selective pressures in their environment.
Another term you may hear associated with convergent evolution is homoplasy or homoplastic traits. This term, homoplasy, is used in cladistics to describe the shared character state that has not been inherited from a common ancestor exhibition of that state. The goal is to NOT have these traits on our evolutionary trees as it will give us the wrong information about who is closely related to whom.
If scientists are looking at the molecular data of species, there is also potential for confusion. The goal is to find DNA sequences (or the proteins they code for) of different species and compare them to one another. The DNA sequences would need to be from comparable chromosomes (recall the cytochrome c discussion above). The assumption is that if more DNA is shared between species, they are more closely related.
The problem comes when we consider how genes evolve and how DNA changes over time. Sometimes genes (sections of DNA) can be copied and duplicated. Sometimes these new duplicated sections do not do anything (e.g., they may become a non-functional pseudogene, which is a DNA sequence that resembles a gene but has mutated into an inactive form over time) and sometimes they can contribute to changes in the organisms. Let’s say we are comparing the DNA of three organisms together and we will summarize the base sequences as “A.” So instead of writing the whole code of bases like TTCGCAATTGGCAGACT, we will summarize it as “A.” If one species has “A,” another has a duplicated sequence of “AA,” and the third species has “AA,” what does this mean?
We need to know something about the location of these duplicated genes. Is the second “A” right next to the first? Is the second “A” on a different chromosome? Is the second “A” from a duplicated event or not or did it stem from an ancestor?
If we assume the species with only one “A” is the oldest, we can look at the other two to gain some clues about the relationship. If one of the “AA” species has a copy of the DNA in the same place compared to the oldest species, we would say these are orthologs. Another way to state this is to say that orthologs are genes that reflect the conservation of a single gene found in an ancestor.
If instead the second “A” is in a different place compared to the oldest species, we would say these sequences are paralogs to each other. A paralog can arise from a duplication event with the same genome and NOT be passed down from an ancestor.
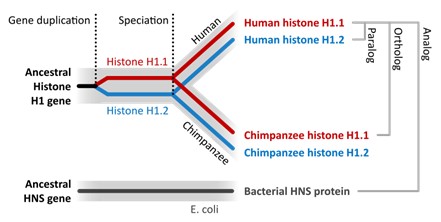
Another way to consider this is to state that orthologous genes stem from a common ancestor (and you would find in two or more species), whereas paralogous genes tend to arise from a duplication event (and you would find in one species; Figure 18.3.10).
If a scientist is examining DNA sequences and sees the same sequences in species “A” versus “A,” if they incorrectly think the second “A” is from an ancestor and therefore an ortholog when it is not (i.e., it is really a paralog), they will incorrectly think the species are more closely related to each other than they are. This is why you might get an incorrect evolutionary tree construct.
In general, it is important to gather as much data as possible. As with all science, the more data you have, the less biased and more reliable your data becomes. This will allow scientists to construct the most reliable hypothesis for the evolutionary trees possible.
Summary
Phylogeny, the evolutionary history, and relationships among species, is of paramount importance in the field of biology. It provides valuable insights into the origin, diversification, and interconnections of life on Earth. Scientists use phylogeny as a foundational tool to study species in various ways, unraveling the complex tapestry of life’s history and understanding the processes that have shaped it.
Key reasons for the importance of phylogeny are as follows:
- Understanding Evolutionary History: Phylogeny allows us to trace the lineage and ancestry of species over time, revealing how they have evolved and adapted to changing environments. It provides a comprehensive framework for understanding the evolutionary transitions, innovations, and extinctions that have occurred throughout Earth’s history.
- Biodiversity Conservation: By understanding the evolutionary relationships among species, scientists can identify key species for conservation efforts. Phylogenetic analyses help prioritize which species are most vulnerable and ecologically important, aiding in the protection of biodiversity and ecosystems.
- Predicting Traits and Behaviors: Phylogenetic trees can provide insights into the traits, behaviors, and adaptations that evolved in specific lineages. By studying related species, scientists can make educated predictions about the characteristics of organisms, helping to uncover functional and ecological aspects of different species.
- Medical and Drug Discovery: Phylogeny aids in studying the evolutionary history of pathogens, such as viruses and bacteria, which can inform the development of treatments and vaccines. Understanding the evolutionary relationships of these organisms helps scientists predict how they might evolve and spread in the future.
- Comparative Studies: Phylogenetic analyses allow scientists to compare traits and genetic information across different species. By examining similarities and differences, researchers can gain insights into the mechanisms behind traits, behaviors, and diseases, contributing to fields like physiology, genetics, and medicine.
- Biogeography: Studying the distribution of species across geographic regions can provide clues about how continents and ecosystems have changed over time. Phylogenetic analyses help explain patterns of species distribution and migration, contributing to our understanding of Earth’s geological history.
Scientists utilize both morphological (physical characteristics) and molecular (genetic) data to construct evolutionary trees or cladograms, visual representations that depict the evolutionary relationships between species. These approaches offer complementary insights, allowing researchers to create more accurate and comprehensive depictions of evolutionary history. Scientists analyze the physical traits and structures of different species. Similarities and differences in features such as bone structure, skeletal elements, organs, and body shape provide clues about evolutionary relationships. Shared traits (homologies) are indicative of common ancestry, while differences (analogy or homoplasy) might suggest convergent evolution. Scientists also use genetic data, particularly DNA sequences, to study evolutionary relationships. Scientists compare the genetic code of different species, focusing on specific genes or regions that are conserved across organisms. Similarities in DNA sequences indicate shared ancestry.
Both morphological and molecular data play crucial roles in building accurate evolutionary trees or cladograms. These methods allow scientists to piece together the puzzle of life’s history, uncovering the connections and patterns that have shaped the diversity of species on Earth.
Practice Questions
Glossary
Figure Descriptions
Figure 18.3.1. A left-rooted evolutionary tree depicts major vertebrate groups across the top with small drawings and labels: “sharks,” “ray-finned fish,” “amphibians,” “primates,” “rodents & rabbits,” “crocodiles,” and “dinosaurs & birds.” Along the trunk, red tick marks label trait appearances: at the base “vertebrae,” then higher “bony skeleton,” then “four limbs,” then “amniotic egg.” The amniote branch splits: one branch leads to mammals, marked “hair,” which then divides into “primates” and “rodents & rabbits”; the other branch leads to reptiles/birds, ending in “crocodiles” and “dinosaurs & birds,” and is labeled “two post-orbital fenestrae.” The layout shows closer relatives share later traits. For example, crocodiles with dinosaurs & birds, while sharks branch off earliest. [Return to Figure 18.3.1]
Figure 18.3.2. The left panel is a photo comparison of ankle bones with labels “pronghorn antelope” and “Eocene whales,” plus a “2 cm” scale bar. Rectangles highlight the pulley-shaped surfaces: a yellow box on the pronghorn bone and white boxes on two Eocene whale fossils, indicating the same double-pulley talus morphology. The right panel is a simplified cladogram labeled at the tips “Camels,” “Pigs,” “Ruminants,” “Whales,” and “Hippos.” A red tick on the stem reads “Double pulley ankle evolves,” a later red bar on the whale branch says “ankle bones lost,” and a circled arrow notes “These whales should have a double pulley ankle.” A legend states “? = No ankle + = Double pulley ankle,” with green plus signs marking groups that retain the structure. Together the panels illustrate that fossil whales share the distinctive artiodactyl ankle design, supporting close relationship to hoofed grazers such as hippos and cows. [Return to Figure 18.3.2]
Figure 18.3.4. A three-part figure shows a bat, a bird, and a honeybee, each with a white line overlay of wing structure. Panel labels read “(a) Bat wing,” “(b) Bird wing,” and “(c) Insect wing.” In (a) a bat spreads a translucent membrane supported by elongated finger bones; a skeletal outline of the humerus, radius/ulna, wrist, and digits is drawn beside it. In (b) a soaring bird (wing feathers extended) is paired with an outline of the bony forelimb and fused digits. In (c) a honeybee on a flower displays a thin, transparent wing with an overlay of its vein network (no bones). The similar overall shapes and flight function contrast with their different materials and developmental origins (bat and bird wings are bony forelimbs, whereas the insect wing is a veined membrane) illustrating homoplasy rather than shared ancestry. [Return to Figure 18.3.4]
Figure 18.3.6. The figure contains two phylogenetic trees comparing the three domains of life, using the same color code: blue = Bacteria, green = Archaea, red = Eukarya. Panel (a) Rooted phylogenetic tree shows a basal split where the three colored branches meet. The blue bacterial branch includes labels such as Spirochetes, Cyanobacteria, Planctomycetes, Bacteroides cytophaga, Thermotoga, Aquifex, Gram-positives, and Green filamentous bacteria. The green archaeal branch lists Methanobacterium, Methanosarcina, Methanococcus, T. celer, Thermoproteus, Pyrodictium, and Halophiles. The red eukaryotic branch fans to Entamoebae, Slime molds, Animals, Fungi, Plants, Ciliates, Flagellates, Trichomonads, Microsporidia, and Diplomonads. Panel (b) Unrooted phylogenetic tree is drawn as a circular, rootless network with the same color coding. Blue bacterial labels include Gram-positives, Chlamydiae, Green nonsulfur bacteria, Actinobacteria, Planctomycetes, Spirochaetes, Fusobacteria, Cyanobacteria (blue-green algae), Thermophilic sulfate-reducers, Acidobacteria, and Proteobacteria. The green archaeal labels are Crenarchaeota, Nanoarchaeota, and Euryarchaeota. The red eukaryotic labels include Animals, Fungi, Slime molds, Plants, Algae, and Protozoa. [Return to Figure 18.3.6]
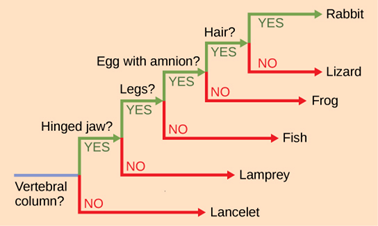
Figure 18.3.7. A ladder-like, rooted phylogenetic tree classifies vertebrates by a series of branching questions labeled along the trunk: “Vertebral column?,” “Hinged jaw?,” “Legs?,” “Egg with amnion?,” and “Hair?” At each node a green arrow labeled “YES” continues upward, while a red arrow labeled “NO” runs horizontally to a taxon lacking that character. From the base, “NO” leads to Lancelet. “YES” at “Vertebral column?” leads to the next node, where “NO” points to Lamprey and “YES” to “Hinged jaw?” continues to Fish. From “Legs?” the “NO” branch ends at Fish, while “YES” leads to Frog (shown after the “Legs?” node with “NO” at “Egg with amnion?”). At “Egg with amnion?” the “YES” path proceeds to Lizard (with “NO” at “Hair?”) and the final “YES” at “Hair?” ends at Rabbit. The diagram illustrates how shared characters place organisms into groups. [Return to Figure 18.3.7]
Figure 18.3.9. Two cladograms are shown side-by-side, labeled “Hypothesis 1” (left) and “Hypothesis 2” (right), each with blue branches and red tick marks for character origins; the same terminal labels appear across both trees from left to right: sharks, ray-finned fish, amphibians, primates, rodents & rabbits, crocodiles, and dinosaurs & birds. In Hypothesis 1, red labels along the main trunk read “Vertebrae,” “BONY SKELETON” (magenta), “Four limbs,” and “Amniotic egg,” with an additional tick on the mammal branch labeled “Hair” and one on the archosaur branch labeled “Two post-orbital fenestrae.” In Hypothesis 2, the same taxa and labels appear but “BONY SKELETON” (magenta) is shifted higher relative to “Vertebrae,” while “Four limbs,” “Amniotic egg,” “Hair,” and “Two post-orbital fenestrae” remain as character steps; the juxtaposition emphasizes that the two hypotheses differ only in the placement of “BONY SKELETON,” implying a different number of evolutionary changes. [Return to Figure 18.3.9]
Figure 18.3.10. A schematic phylogeny has two vertical dashed lines labeled “Gene duplication” and “Speciation.” A black trunk labeled “Ancestral Histone H1 gene” splits before speciation into a red branch labeled “Histone H1.1” and a blue branch labeled “Histone H1.2.” After the “Speciation” line, each branch splits into “Human” and “Chimpanzee,” yielding four tips labeled in full: “Human histone H1.1” (red), “Human histone H1.2” (blue), “Chimpanzee histone H1.1” (red), and “Chimpanzee histone H1.2” (blue). Brackets at the right mark relationship types: “Paralog” groups H1.1 vs. H1.2 within a species; “Ortholog” links the same gene between species; “Analog” points to a separate grey bar beneath the tree labeled “Ancestral HNS gene—E. coli—Bacterial HNS protein.” The figure emphasizes that human H1.1 and chimpanzee H1.1 are orthologs (diverged by speciation), whereas human H1.1 and human H1.2 are paralogs (produced by an earlier duplication). [Return to Figure 18.3.10]
References
Understanding Evolution Website, University of California, Berkeley. Found at https://evolution.berkeley.edu/.
Bartee, L., Shriner, W., & Creech, C. Reading phylogenetic trees and limitations of trees. Principles of Biology. Found at https://openoregon.pressbooks.pub/mhccmajorsbio/
Licenses and Attributions
This chapter, “Building and Using Phylogenetic Trees,” by Elizabeth Dahlhoff, is adapted from chapters in the “Evolution” section in Introductory Biology: Ecology, Evolution, and Biodiversity by Erica Kosal (North Carolina State University) under a CC BY-NC 4.0 license. This work is licensed under a CC BY-NC 4.0 license.
Media Attributions
- patterns_intro_english is licensed under a CC0 (Creative Commons Zero) license
- ankles_2020_Philip-D.-Gingerich_and_whale_ankles
- phylogeny3
- phylogeny4
- phylogeny9
- phylogeny12 © Eric Gaba is licensed under a CC BY (Attribution) license
- phylogeny14 is licensed under a CC BY (Attribution) license
- phylogeny15
- phylogeny16a
- phylogeny17
