19.1 Transcriptional Regulation of the lac Operon
Michelle McCully
Learning Objectives
By the end of this chapter, you will be able to do the following:
- Describe transcription in bacteria.
- Describe translation in bacteria.
- Identify the elements of an operon.
- Describe how lactose, allolactose, and the lac repressor repress transcription of the lac operon.
- Describe how glucose, cAMP, and CRP activate transcription of the lac operon.
- Predict whether the lac operon will be transcribed in the presence or absence of glucose and lactose.
1. Review of Prokaryotic Transcription and Translation
Genes are composed of DNA and are linearly arranged on chromosomes. Genes specify the sequences of amino acids, which are the building blocks of proteins. In turn, proteins are responsible for orchestrating nearly every function of the cell. Both genes and the proteins they encode are absolutely essential to life as we know it.
Transcription in Bacteria
The bacterial chromosome is a closed circle of double-stranded DNA that is found in the central region of the cell called the nucleoid region. Prokaryotic genomes are very compact, and prokaryotic transcripts often cover more than one gene or cistron, a coding sequence for a single protein. Polycistronic mRNAs are then translated to produce multiple proteins.
A promoter is a DNA sequence onto which the transcription machinery, including RNA polymerase, binds and initiates transcription. In most cases, promoters exist upstream of the genes they regulate. The specific sequence of a promoter is very important because it determines whether the corresponding gene is transcribed all the time, some of the time, or infrequently.
Transcription in prokaryotes (and in eukaryotes) requires the DNA double helix to partially unwind in the region of mRNA synthesis. The region of unwinding is called a transcription bubble. The protein, RNA polymerase, carries out transcription, reading from the template strand of the DNA, in the 3’ to 5’ direction.
RNA polymerase proceeds along the DNA template strand, pairing A, C, U, and G nucleotides to the DNA’s T, G, A, and C nucleotides, respectively. RNA polymerase catalyzes the formation of phosphodiester bonds between the mRNA nucleotides in sequence, synthesizing mRNA in the 5′ to 3′ direction at a rate of approximately 40 nucleotides per second. As elongation proceeds, the DNA is continuously unwound ahead of the core enzyme and rewound behind it, unchanged. Transcription terminates when the RNA polymerase reaches a termination sequence downstream of the genes being transcribed, which causes the RNA polymerase to fall off of the template DNA strand.
Video 19.1.1. DNA Transcription (Basic) by DNA Learning Center
Translation in Bacteria
For cells that are growing and dividing, the synthesis of proteins consumes more of a cell’s energy than any other metabolic process. In turn, proteins account for more mass than any other component of living organisms (with the exception of water), and proteins perform virtually every function of a cell. The process of translation, or protein synthesis, involves the decoding of an mRNA message into a polypeptide product. Amino acids are covalently strung together by interlinking peptide bonds in lengths ranging from approximately 50 to more than 1,000 amino acid residues. Each individual amino acid has an amino group (NH2) and a carboxyl (COOH) group. Polypeptides are formed when the amino group of one amino acid forms an amide (i.e., peptide) bond with the carboxyl group of another amino acid. This reaction is catalyzed by ribosomes and generates one water molecule.
Translation requires the input of an mRNA template, ribosomes, tRNAs, and various enzymatic factors. A ribosome is a complex macromolecule composed of structural and catalytic rRNAs and many proteins. Ribosomes exist in the cytoplasm of prokaryotes. Each mRNA molecule is simultaneously translated by many ribosomes, all synthesizing protein in the same direction: reading the mRNA from 5′ to 3′ and synthesizing the polypeptide from the N terminus to the C terminus.
The tRNAs are structural RNA molecules that serve as adapter molecules. Each tRNA carries a specific amino acid and recognizes one or more of the mRNA codons that define the order of amino acids in a protein. Aminoacyl-tRNAs bind to the ribosome and add the corresponding amino acid to the growing polypeptide chain. Therefore, tRNAs are the molecules that actually “translate” the language of RNA into the language of proteins.
As with mRNA synthesis, protein synthesis can be divided into three phases: initiation, elongation, and termination. In initiation, a sequence upstream of the first AUG codon interacts with the rRNA molecules that compose the ribosome and anchors the ribosome at the correct location on the mRNA template. The initiator tRNA then interacts with the start codon AUG, whose tRNA carries the amino acid methionine. During elongation, the mRNA template provides tRNA binding specificity. As the ribosome moves along the mRNA, each mRNA codon comes into register, and specific binding with the corresponding charged tRNA anticodon is ensured. Termination of translation occurs when a stop codon (UAA, UAG, or UGA) is encountered. When encountered, these stop codons are recognized by protein release factors that resemble tRNAs. This reaction forces the previous amino acid to detach from its tRNA, and the newly made protein is released.
Video 19.1.2. mRNA Translation (Basic) by DNA Learning Center
Connecting Concepts
For more on:
- Central Dogma and genetic code, see The Genetic Code
- Transcription: promoters, RNA polymerase, and mRNA, see Transcription: From Gene to Message
- Translation: the ribosome, tRNAs, and phases of protein synthesis, see Ribosomes and Protein Synthesis
Practice Question
2. Operons as Units of Transcriptional Regulation
For a cell to function properly, necessary proteins must be synthesized at the proper time and place. All cells control or regulate the synthesis of proteins from information encoded in their DNA. The process of activating the molecules that produce RNA through transcription and protein through translation is called gene expression. Whether in a simple unicellular organism or a complex multicellular organism, each cell controls when and how its genes are expressed. For this to occur, there must be internal chemical mechanisms that control when a gene is expressed to make RNA and protein, how much of the protein is made, and when it is time to stop making that protein because it is no longer needed.
The regulation of gene expression conserves energy and matter. Transcription and translation require ATP, so it would require a significant amount of energy for an organism to express every gene at all times. In addition, every RNA and protein molecule is composed of nucleotides or amino acids, respectively. These subunit molecules must ultimately be made by recycling other molecules, taken up by the organism from the environment, or synthesized from nutrients acquired from the environment. A cell conserves energy and matter by only expressing the subset of genes that are required for its function at any given time.
The control of gene expression is extremely complex. Malfunctions in this process are detrimental to the cell and can lead to the development of many diseases in humans, including cancer.
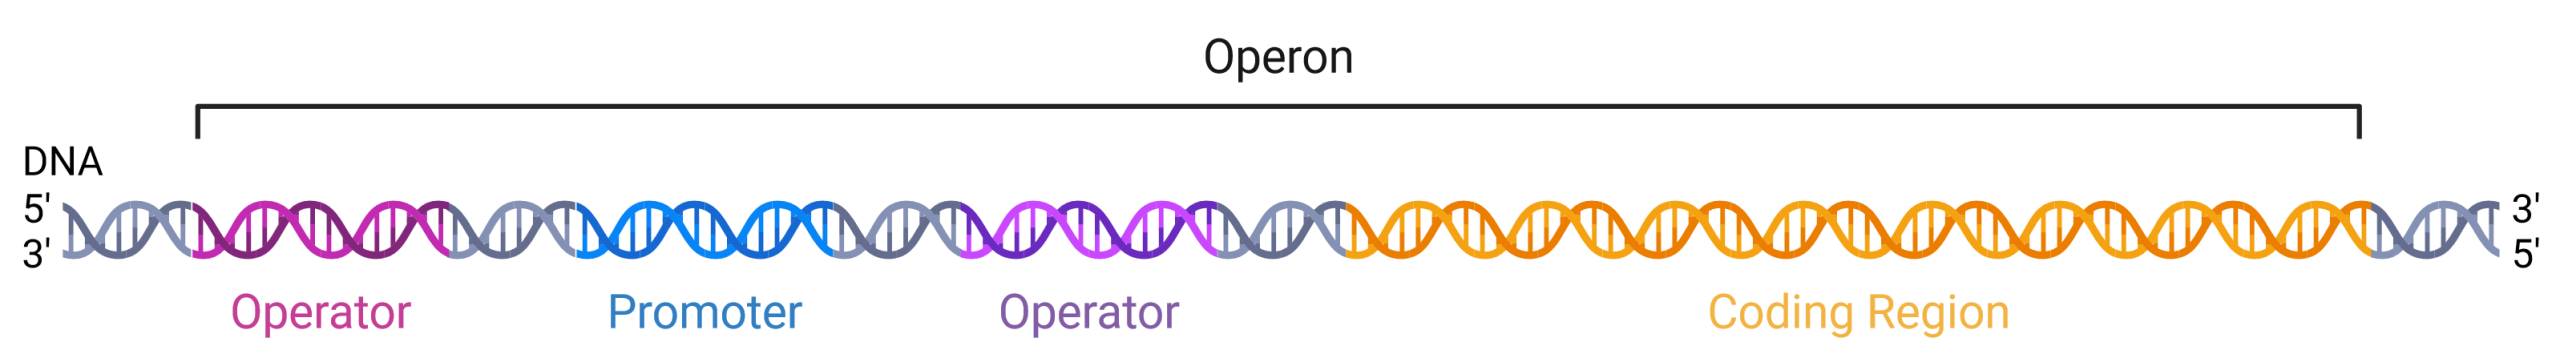
The DNA of prokaryotes is organized into a circular chromosome within the nucleoid region of the cell cytoplasm. Proteins that are needed for a specific function, or that are involved in the same biochemical pathway, are often encoded together in the coding region of an operon, which are transcribed as a single mRNA molecule (Figure 19.1.1). For example, all of the genes needed to use lactose as an energy source are coded next to each other in the coding region of the lac operon. The promoter and operators are located upstream of the coding region and are regions of the DNA where the proteins that regulate and carry out transcription bind. For example, RNA polymerase binds to the promoter site and then slides downstream, transcribing the coding region as it passes. An operator is a region of DNA where regulatory proteins that either activate or repress transcription of the operon bind. Promoters and operators are not themselves genes because they do not encode proteins; rather, they are non-coding DNA.
In prokaryotic cells, there are three types of regulatory molecules that can affect the expression of operons: repressors, activators, and inducers. Repressors and activators are proteins produced in the cell. Both repressors and activators regulate gene expression by binding to specific DNA sites upstream of the genes they control. Repressors prevent transcription of a gene in response to an external stimulus, whereas activators increase the transcription of a gene in response to an external stimulus. How an operator is positioned relative to the promoter is critical to the function of the regulatory protein, allowing it to either support the binding of RNA polymerase (an activator) or interfere with RNA polymerase (a repressor). Inducers are small molecules that may be produced by the cell or that are in the cell’s environment, which affect the behavior of activators or repressors.
Practice Questions
3. Transcriptional Repression
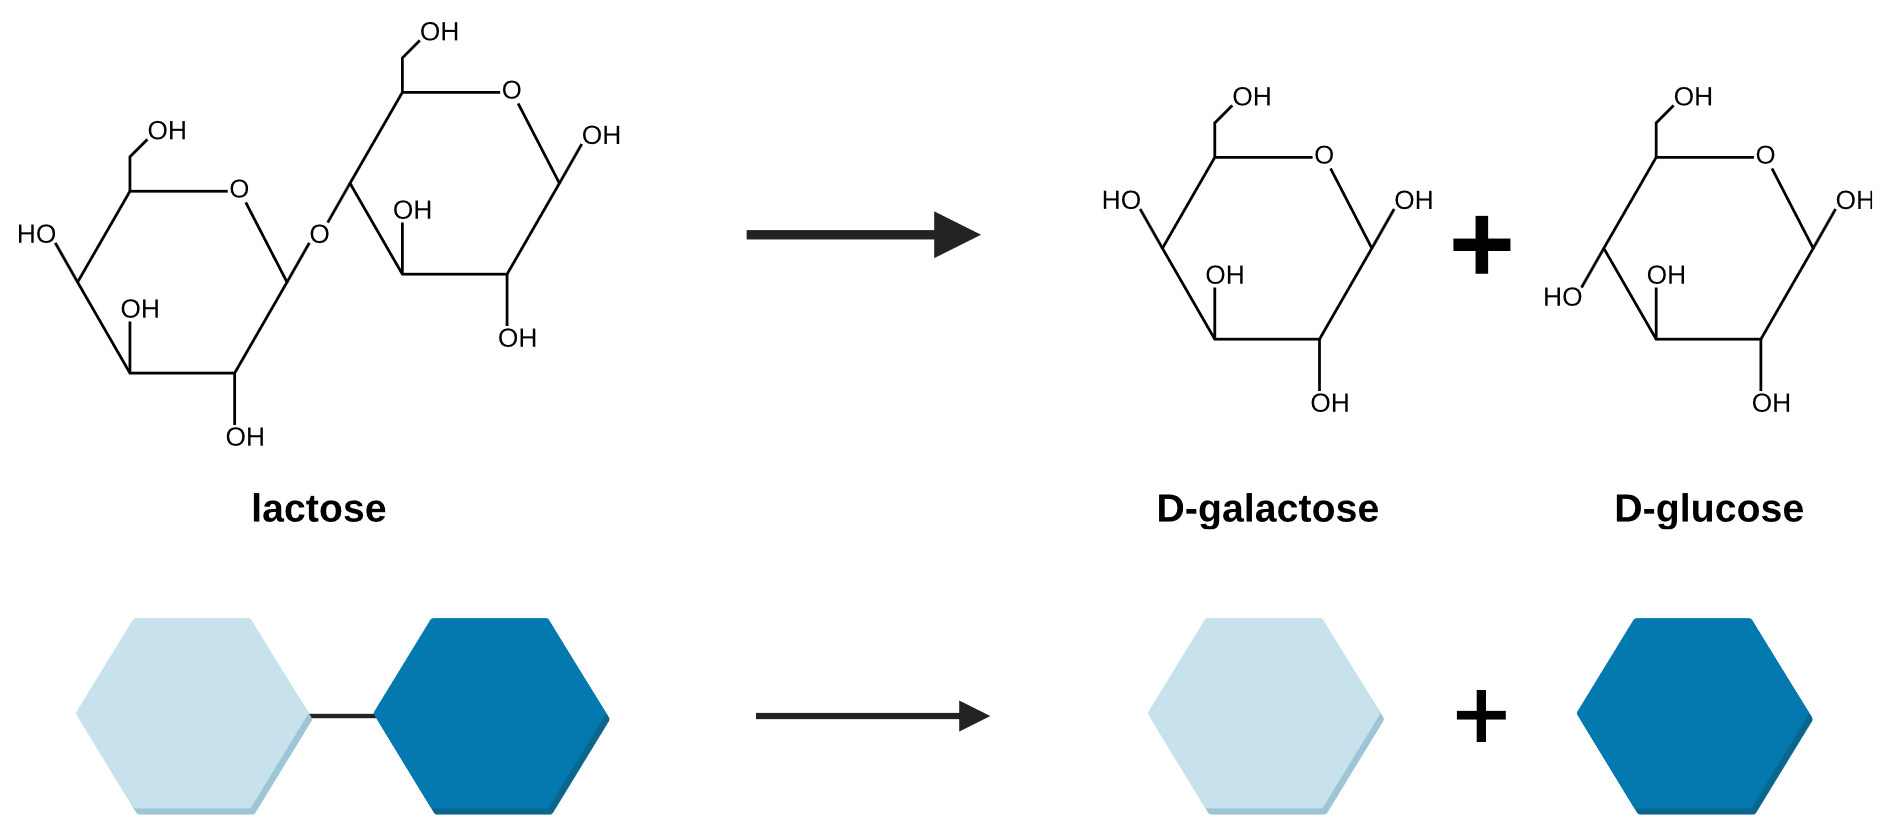
Most organisms, including the bacteria Escherichia coli, preferentially use glucose to perform cellular respiration in order to survive. If glucose is not available, E. coli are able to import other sugars from the environment and metabolize them into glucose. Lactose is one such sugar that E. coli can ingest from its environment and metabolize into glucose (Figure 19.1.2). It is a disaccharide made of the two monosaccaride molecules, glucose and galactose, bound together. If glucose is present in the environment, there is no need for the E. coli to expend energy and matter expressing the proteins needed to uptake and digest lactose. However, if glucose is not present and lactose is, the E. coli would benefit from using lactose as a source of glucose.
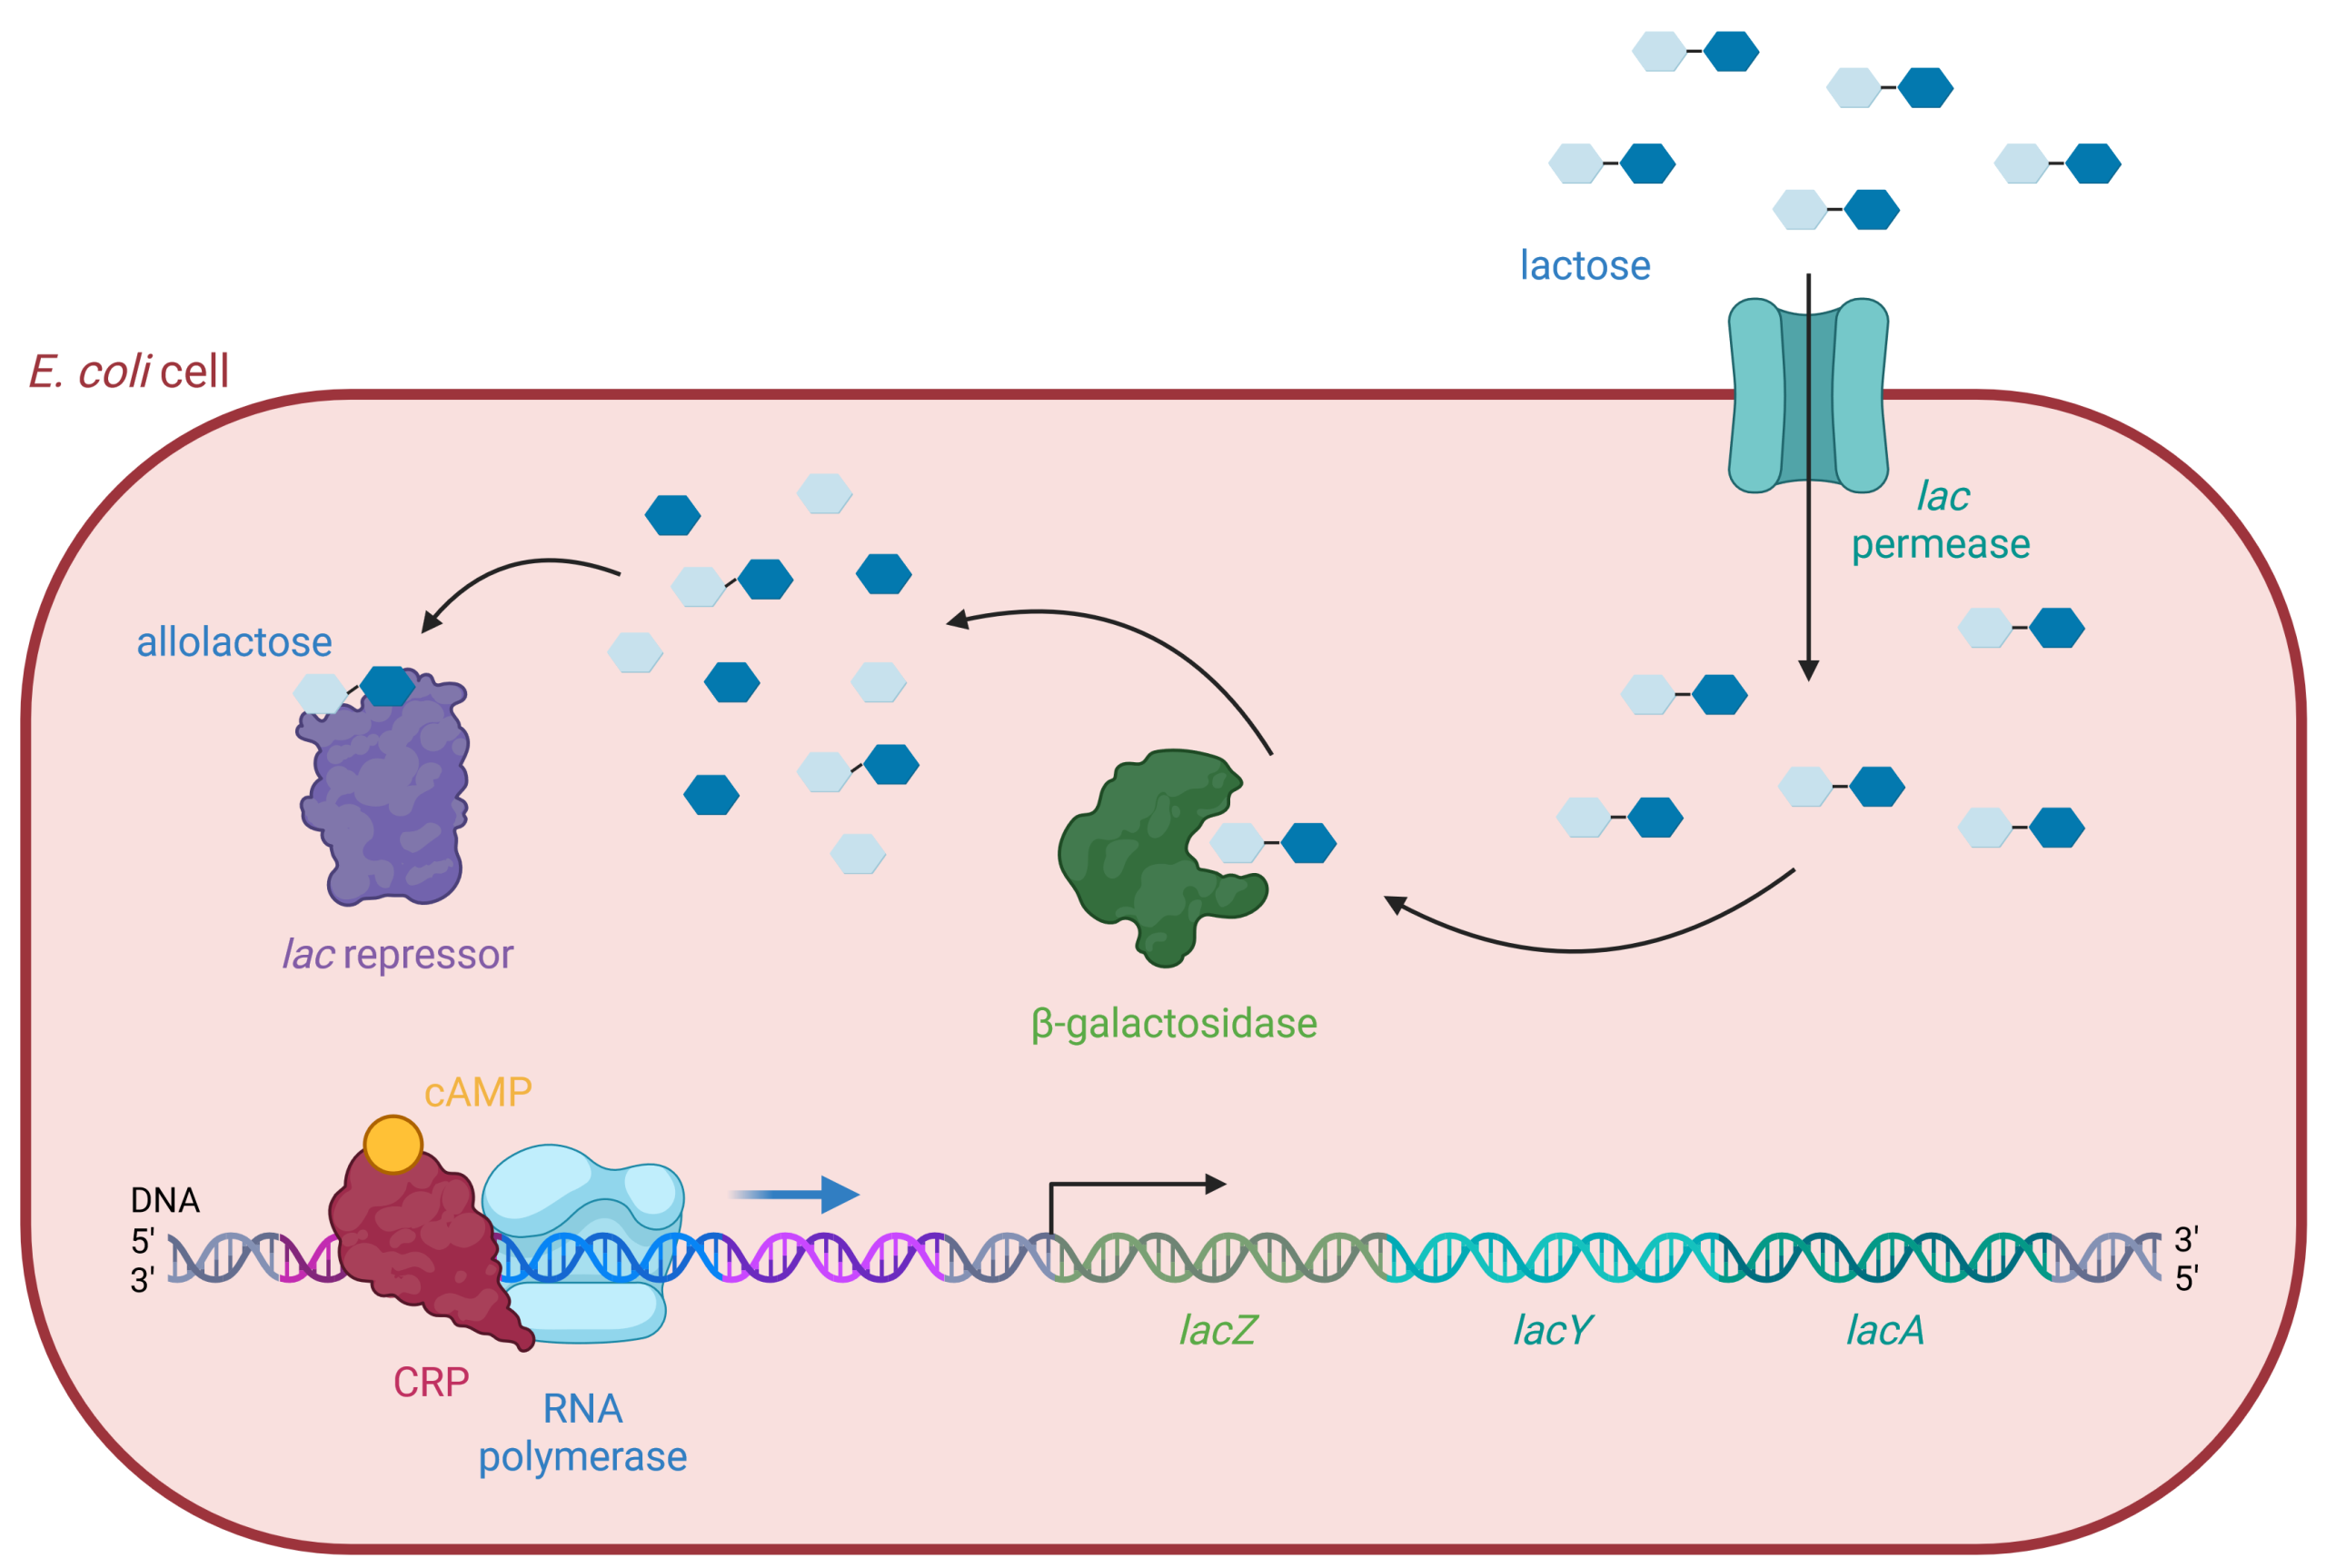
The genes required for E. coli to import lactose and break it down into glucose are located together on its chromosome in the lac operon. The coding region of the lac operon includes the genes for three proteins (Figure 19.1.3). lacZ encodes the enzyme, β-galactosidase or LacZ, which breaks down lactose into its monosaccharides, glucose and galactose. lacY encodes the membrane transport protein, β-galactoside permease or LacY, which moves lactose from outside the cell to inside the cell. lacA encodes the enzyme β-galactoside transacetylase or LacA, and its role in lactose metabolism is unclear.
The lac operon includes three important regions: the lac promoter, two operators, and the coding region. The promoter region is where RNA polymerase binds to initiate transcription. Just upstream is the operator region, where an activator can bind, and downstream is the operator region where a repressor can bind. Next comes the transcriptional start site, immediately followed by the coding region, which contains the three genes lacZ, lacY, and lacA.
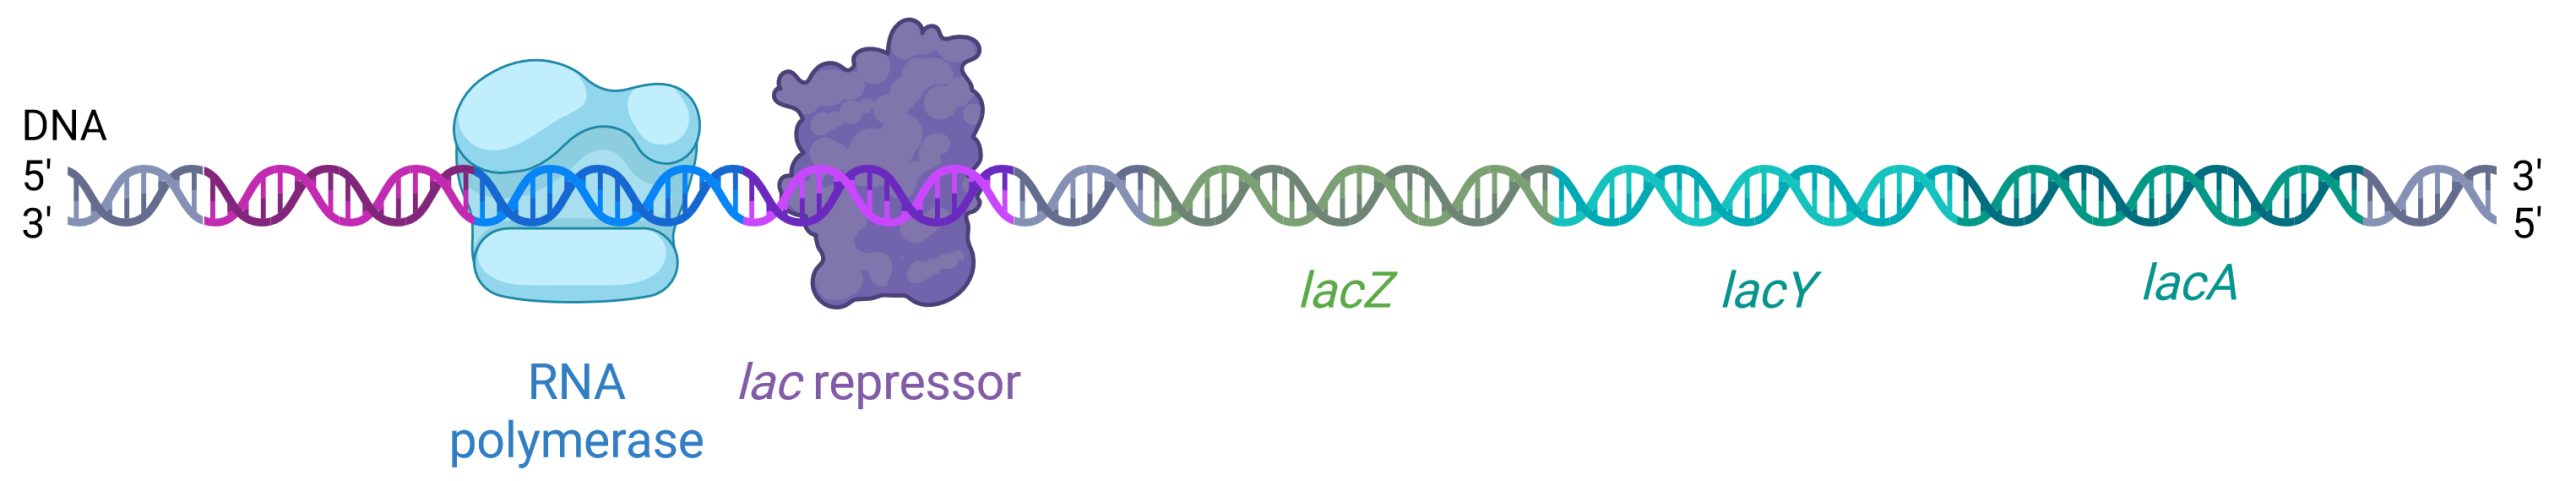
The lac operator downstream of the promoter contains the DNA sequence to which the lac repressor protein can bind. When the lac repressor binds to this operator region, it physically blocks RNA polymerase from progressing downstream to the coding region, halting transcription (Figure 19.1.4). The lac repressor is expressed constitutively, meaning always, in E. coli. Its gene is located elsewhere on the E. coli chromosome, not in the lac operon.
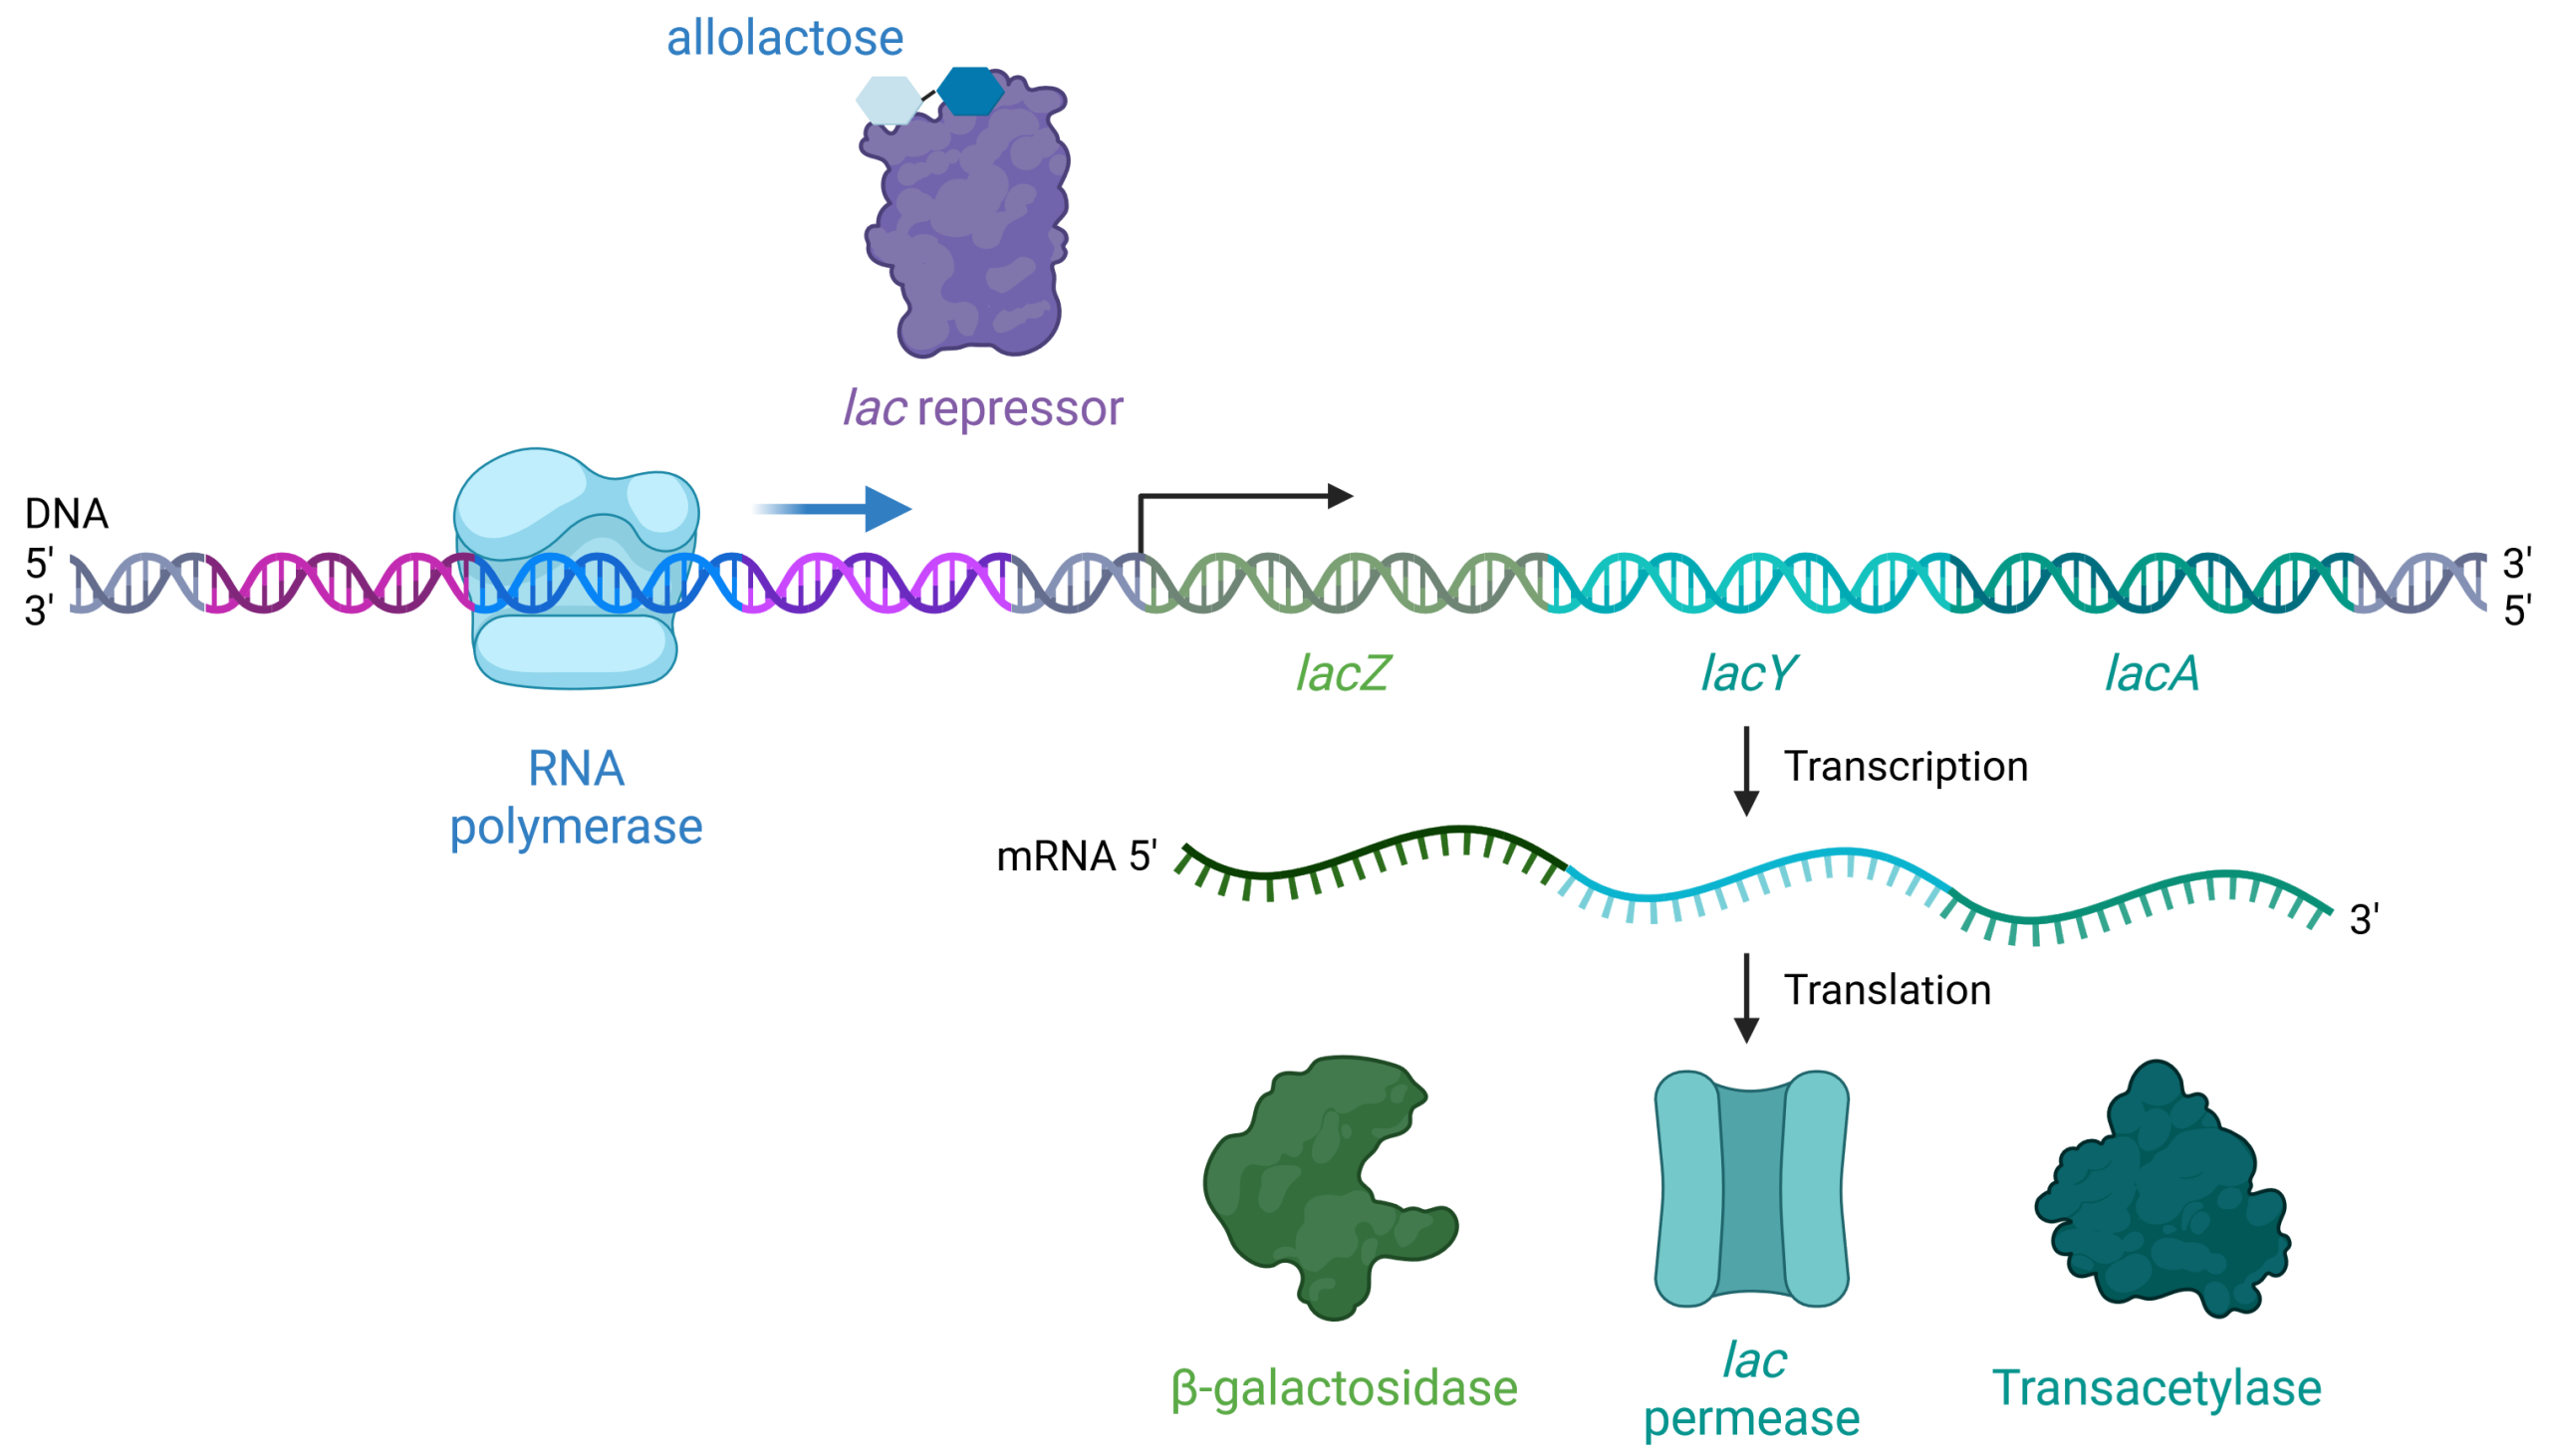
When there is allolactose present, allolactose binds to the lac repressor and causes it to change shape such that it no longer fits on the lac operator (Figure 19.1.5). When β-galactosidase breaks down lactose, 90% of the time the lactose breaks down all the way to glucose and galactose, but the other 10% of the time, it isomerizes into allolactose. When lactose is isomerized to allolactose, the allolactose can bind the lac repressor and block it from binding to the lac operator. Thus, RNA polymerase is not blocked, and it can initiate transcription of the lac genes to digest lactose.
Practice Questions
Images created in BioRender.com.
4. Transcriptional Activation
Just as the lac operon is negatively regulated by the lac repressor binding to the operator, there is an activator protein that binds to the operator upstream of the promoter, acting as as positive regulator to turn on transcription. When glucose is scarce, E. coli can turn to other sugar sources for fuel. To do this, the genes to digest these alternate sugars and transform them into glucose must be transcribed.
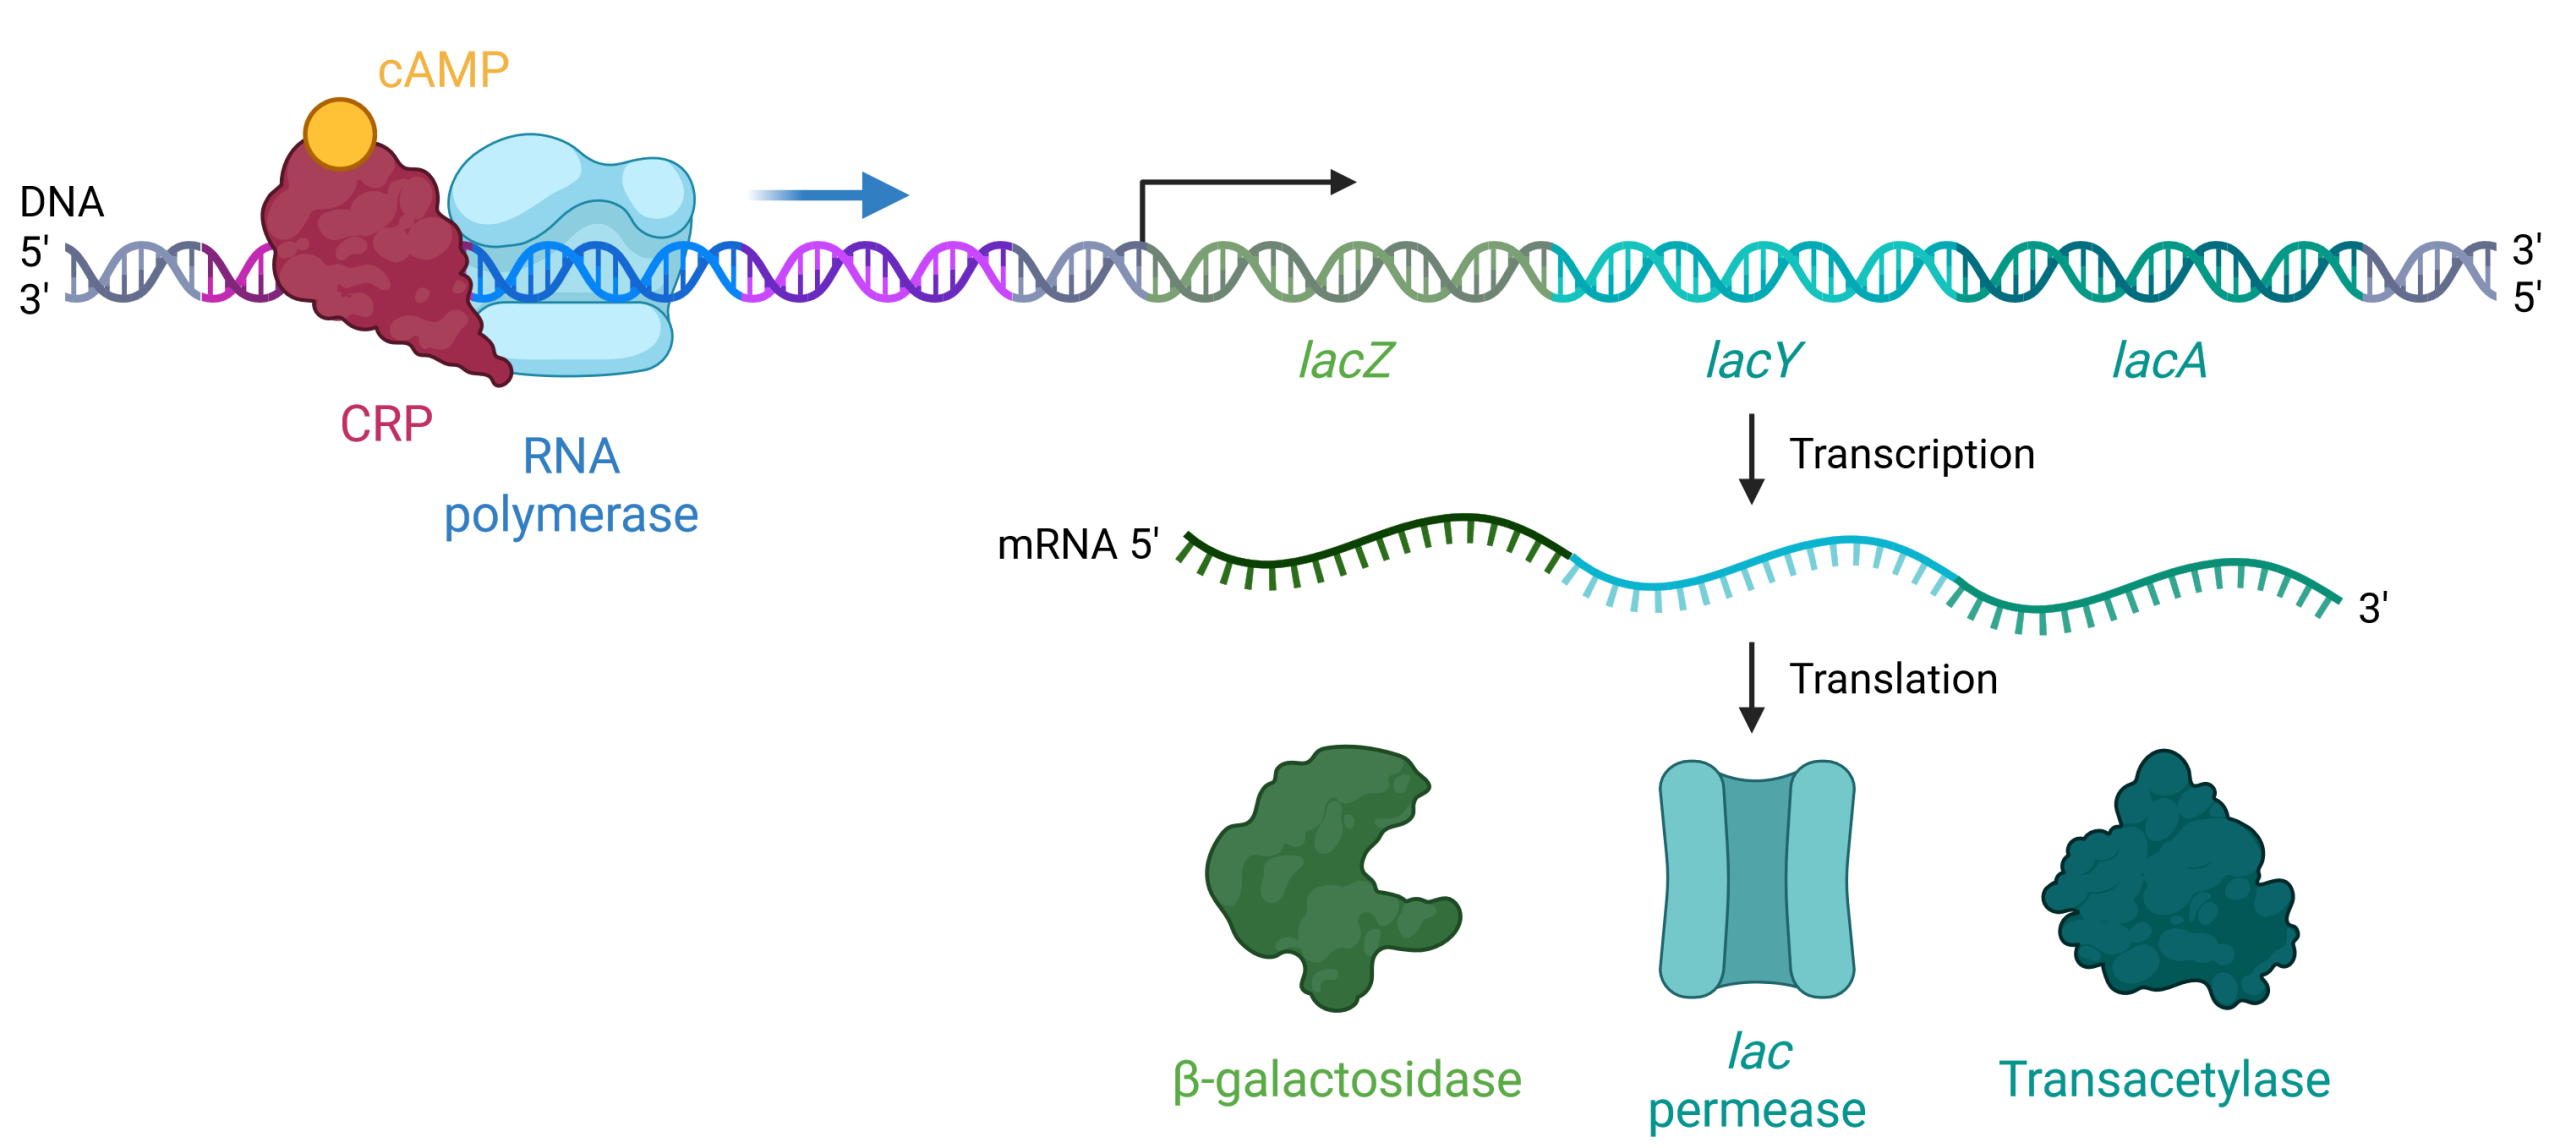
When glucose levels drop, cyclic AMP (cAMP) begins to accumulate in the cell. cAMP is a small, signaling molecule that is involved in energy metabolism in E. coli. Accumulating cAMP binds to the positive regulator, cAMP receptor protein (CRP), a protein that binds to the promoters of many operons that control the processing of alternative sugars, including the lac operon (Figure 19.1.6). CRP is also known as catabolite activator protein (CAP), and the names CRP and CAP may be used interchangeably.
When cAMP binds to CRP, the complex then binds to the CRP operator region of the lac operon, just upstream of the promoter where RNA-polymerase binds. The binding of CRP stabilizes the binding of RNA polymerase to the promoter region and increases transcription of the genes in the coding region of the operon.
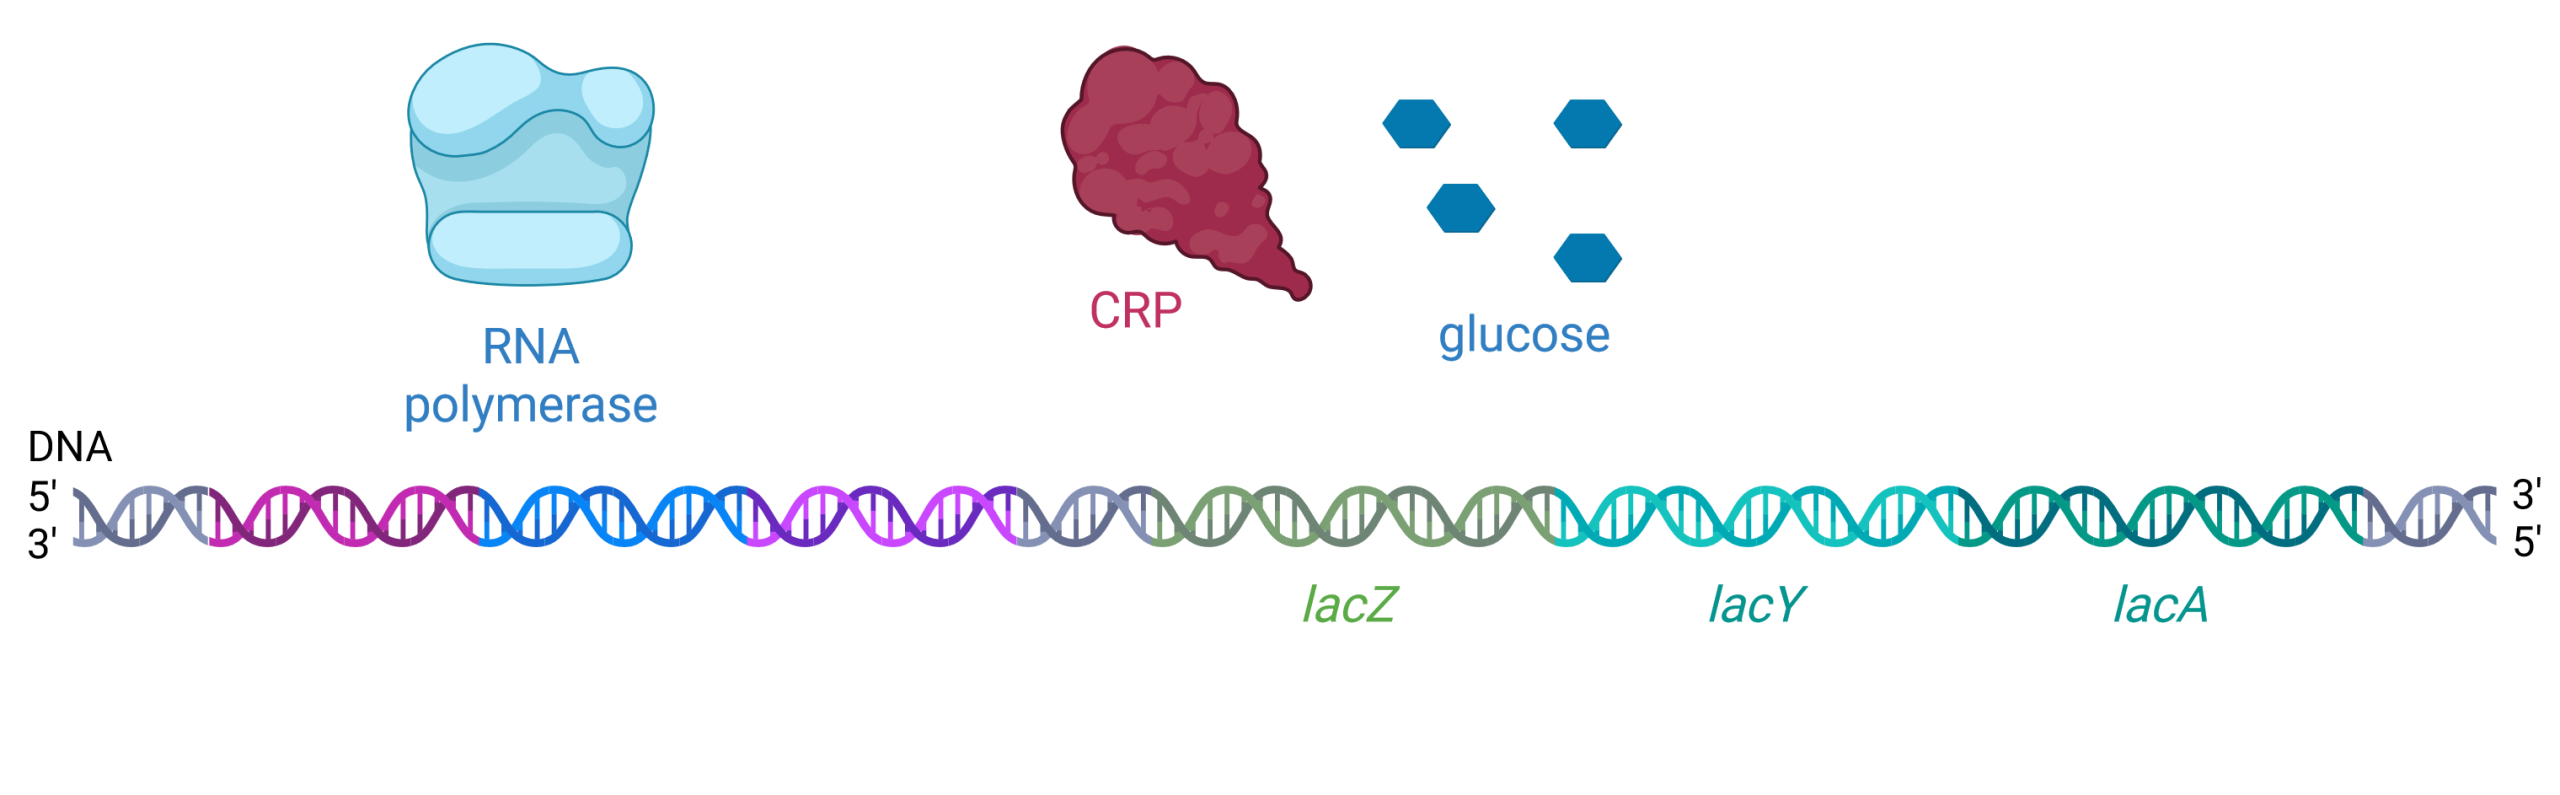
If E. coli cells are in an environment where there is plentiful glucose, glucose molecules will enter the cell through the glucose permease membrane protein. When glucose levels are high in the cell, cellular levels of cAMP are low. Without cAMP bound, CRP changes conformation and cannot bind the promoter region (Figure 19.1.7). The lac operon has evolved to have a very weak promoter, meaning RNA polymerase does not bind the promoter region very tightly unless cAMP + CRP are present to increase its binding affinity. Therefore, in the presence of glucose, RNA polymerase does not bind as tightly to the promoter region, and expression of the lac operon is low. There is no need for the cell to waste energy and matter building the proteins encoded by the lac operon when there is abundant glucose available for cellular respiration.
Practice Questions
Images created in BioRender.com.
5. Activation and Repression Control lac Operon Expression
E. coli only need to expend energy and matter expressing the genes necessary to digest lactose when two conditions are both met: 1) glucose is not present; and 2) lactose is present. There is no reason to make the proteins that import and digest lactose if glucose is present, and there is no need to make these proteins if there is no lactose available in the environment (Table 19.1.1).
Only when glucose is absent and lactose is present will the lac operon be transcribed. In the absence of glucose, the cAMP + CRP binds to the lac promoter and makes transcription of the lac operon more effective. When lactose is present, its metabolite (allolactose) binds to the lac repressor and changes its shape so that it cannot bind to the lac operator to prevent transcription. This combination of conditions makes sense for the cell, because it would be energetically wasteful to synthesize the enzymes to process lactose if glucose was plentiful or lactose was not available.
If glucose is present, then CRP fails to bind to the promoter sequence to activate transcription. If lactose is absent, then the lac repressor binds to the operator to prevent transcription. If either of these conditions is met, then transcription remains off. Only when glucose is absent and lactose is present is the lac operon transcribed at a high rate.
Practice Questions
Images created in BioRender.com.
Figure Descriptions
Figure 19.1.1. The image depicts a segment of DNA as part of an operon structure, visualized as a double helix. The DNA strand runs horizontally across the image from left to right. The left side is marked as the 5′ end and the right side as the 3′ end, indicating the direction of the DNA sequence. The DNA is color-coded into three distinct regions: the Promoter region is colored in blue, the Operator region in purple, and the Coding Region in orange. Above the DNA strand, a black bracket labeled “Operon” spans across these three regions. The background is white, emphasizing the colored segments. [Return to Figure 19.1.1]
Figure 19.1.2. The image depicts a chemical reaction process in which lactose is broken down into D-galactose and D-glucose. At the top, there are structural chemical formulas. On the left, lactose is shown as two connected hexagonal ring structures. To the right, an arrow points towards two separate hexagonal ring structures, representing D-galactose and D-glucose, with a plus sign in between them. Below the formulas, a simplified graphical representation mirrors the above process using colored hexagons. On the left, a light blue hexagon is linked to a dark blue hexagon representing lactose. An arrow points to the right toward two separate hexagons, one light blue representing D-galactose and one dark blue representing D-glucose, with a plus sign in between them. [Return to Figure 19.1.2]
Figure 19.1.3. This is a schematic diagram depicting the lactose operon regulation mechanism within an E. coli cell. The diagram is framed by a red oval outline representing the boundary of the E. coli cell. The background inside the cell is a light pink color. There are several key elements and labels in the image, elaborating the process of lactose metabolism. Starting from the top right, blue hexagons represent lactose molecules outside the cell, entering through a membrane protein labeled “lac permease.” Once inside, lactose can be converted into allolactose, which is shown as hexagons with various shades of blue. Allolactose binds to a purple irregular shape labeled “lac repressor,” inactivating it and allowing for transcription. The middle part of the diagram shows “beta-galactosidase” depicted as a green enzyme, converting lactose into glucose and galactose, represented by blue hexagons. At the bottom left, the DNA is shown as a double helix with different segments marked as lacZ, lacY, and lacA, respectively. Colored proteins including “cAMP,” “CRP,” and “RNA polymerase” interact with the DNA strand to regulate the transcription process. [Return to Figure 19.1.3]
Figure 19.1.4. The image is a schematic representation of DNA with associated proteins, illustrating the process of transcription regulation. The double-helix DNA strand runs horizontally across the image, transitioning from left to right. At the left end of the DNA strand, there is a blue-shaded structure labeled “RNA polymerase” that is bound to the DNA. This structure is represented with a slight transparency and is roughly cubic in shape, with smooth contours. Adjacent to this, towards the right, is a purple, irregularly shaped structure labeled “lac repressor” also bound to a segment of the DNA. The DNA sequence includes three distinct sections labeled “lacZ,” “lacY,” and “lacA” in green, teal, and turquoise text respectively. The DNA strand transitions in color between segments, visually differentiating these regions. The ends of the DNA strand are marked with 5′ and 3′ labels indicating the orientation, with “5′” and “3′” labeled at both the leftmost and rightmost ends. [Return to Figure 19.1.4]
Figure 19.1.5. At the top center, a double-helical strand of DNA is shown with its 5′ end labeled on the left and its 3′ end on the right, color-coded with distinct regions in purple (lac repressor binding site), light blue (around RNA polymerase), green (lacZ), blue-green (lacY), and dark cyan (lacA). On the left, a light blue rounded structure labeled “RNA polymerase” is bound to the DNA strand, marking the start of transcription. Toward the upper center, a purple irregular-shaped “lac repressor” is depicted with blue hexagonal allolactose molecules attached. Below the DNA, a wavy green strand labeled “mRNA 5′” on the left and “3′” on the right represents the mRNA being synthesized. The mRNA is divided into segments coding for three enzymes: β-galactosidase, shown as a green cloud-like structure; lac permease, depicted as a teal tubular structure; and transacetylase, represented as a darker green cloud-like structure. Black arrows indicate the processes of transcription (DNA to mRNA) and translation (mRNA to proteins). [Return to Figure 19.1.5]
Figure 19.1.6. The image depicts a molecular biological process involving the transcription and translation of the lac operon, structured in a linear format from top to bottom. At the top left, a DNA strand is shown with a nucleotide sequence represented by a helical structure. Bound to the DNA are a red, irregularly shaped protein labeled “CRP,” and an orange circular molecule labeled “cAMP.” Adjacent to this, a light blue structure representing RNA polymerase is shown, initiating transcription from the DNA template. The DNA sequence is segmented into colored regions labeled “lacZ” in green, “lacY” in turquoise, and “lacA” in teal. Below this, the mRNA transcript is shown emerging, signified by a wavy green and blue line. The mRNA transcript undergoes translation, denoted by arrows, producing three distinct proteins. On the bottom row are illustrations of the resulting proteins: a green, amorphous shape labeled “β-galactosidase,” a turquoise, cylindrical shape labeled “lac permease,” and a dark green, irregular shape labeled “Transacetylase.” [Return to Figure 19.1.6]
Figure 19.1.7. The image depicts a molecular diagram related to gene transcription, showing three distinct elements above a sequence of DNA labeled as “RNA polymerase,” “CRP,” and “glucose.” RNA polymerase is on the left, illustrated as a light blue, abstract shape with smooth curves resembling a cap or enzyme model. CRP (cAMP receptor protein) is in the middle, shown as a dark red, irregular shape with a lumpy texture. Glucose is on the right, represented by five small, dark blue hexagons arranged in a square formation with one hexagon in the center. Below these elements is a DNA strand depicted as a double helix with segments colored in shades of blue, purple, green, and aqua, labeled at the 5′ and 3′ ends. Within the DNA sequence, three specific genes are labeled: “lacZ” in green, “lacY” in teal, and “lacA” in aqua. [Return to Figure 19.1.7]
Licenses and Attributions
“Transcriptional Regulation of the lac Operon” by Michelle McCully is adapted from “15-2-prokaryotic-transcription,” “15-5-ribosomes-and-protein-synthesis,” “16-1-regulation-of-gene-expression,” and “16-2-prokaryotic-gene-regulation” by Mary Ann Clark, Matthew Douglas, and Jung Choi for OpenStax Biology 2e used under CC BY 4.0. “Transcriptional Regulation of the lac Operon” is licensed under CC BY-NC 4.0.
Images created with BioRender are licensed with permission as CC BY-NC 4.0.
Media Attributions
- 1C-J-1.2 Figure – Operon © Michelle McCully is licensed under a CC BY-NC (Attribution NonCommercial) license
- 1C-J-1.3 Figure – Lactose, glucose, galactose © Michelle McCully is licensed under a CC BY-SA (Attribution ShareAlike) license
- 1C-J-1.3 Figure – E coli w lac operon © Michelle McCully is licensed under a CC BY-NC (Attribution NonCommercial) license
- 1C-J-1.3 Figure – lac operon no lactose © Michelle McCully is licensed under a CC BY-NC (Attribution NonCommercial) license
- 1C-J-1.3 Figure – lac operon with lactose © Michelle McCully is licensed under a CC BY-NC (Attribution NonCommercial) license
- 1C-J-1.4 Figure – lac operon without glucose © Michelle McCully is licensed under a CC BY-NC (Attribution NonCommercial) license
- 1C-J-1.4 Figure – lac operon with glucose © Michelle McCully is licensed under a CC BY-NC (Attribution NonCommercial) license
