4.3 Passive Membrane Transport
Learning Objectives
By the end of this section, you will be able to do the following:
- Explain why and how passive transport occurs.
- Describe the diffusion and osmosis processes.
- Define tonicity and its relevance to passive transport.
Plasma membranes must allow certain substances to enter and leave a cell and prevent some harmful materials from entering and some essential materials from leaving. In other words, plasma membranes are selectively permeable (semipermeable)—they allow some substances to pass through, but not others. If they were to lose this selectivity, the cell would no longer be able to sustain itself, and it would be destroyed. Some cells require larger amounts of specific substances. They must have a way of obtaining these materials from extracellular fluids. This may happen passively, as certain materials move back and forth, or the cell may have special mechanisms that facilitate transport. Some materials are so important to a cell that it spends some of its energy, hydrolyzing adenosine triphosphate (ATP), to obtain these materials. Red blood cells use some of their energy doing just that. Most cells spend the majority of their energy to maintain an imbalance of sodium and potassium ions between the cell’s interior and exterior, as well as on protein synthesis.
The most direct forms of membrane transport are passive. Passive transport is a naturally occurring phenomenon and does not require the cell to exert any of its energy to accomplish the movement. In passive transport, substances move from an area of higher concentration to an area of lower concentration. A physical space in which there is a single substance concentration range has a concentration gradient.
Selective Permeability
Plasma membranes are asymmetric: the membrane’s interior is not identical to its exterior. There is a considerable difference between the array of phospholipids and proteins between the two leaflets that form a membrane. On the membrane’s interior, some proteins serve to anchor the membrane to the cytoskeleton’s fibers. There are peripheral proteins on the membrane’s exterior that bind extracellular matrix elements.
Carbohydrates, attached to lipids or proteins, are also on the plasma membrane’s exterior surface. These carbohydrate complexes help the cell bind required substances in the extracellular fluid. This adds considerably to plasma membrane’s selective nature (review Figure 4.2.1 in the previous section).
Recall that plasma membranes are amphipathic: They have hydrophilic and hydrophobic regions. This characteristic helps move some materials through the membrane and hinders the movement of others. Non-polar and lipid-soluble material with a low molecular weight can easily slip through the membrane’s hydrophobic lipid core. Substances such as the fat-soluble vitamins A, D, E, and K readily pass through the plasma membranes in the digestive tract and other tissues. Fat-soluble drugs and hormones also gain easy entry into cells and readily transport themselves into the body’s tissues and organs. Oxygen and carbon dioxide molecules have no charge and pass through membranes by simple diffusion.
Polar substances present problems for the membrane. While some polar molecules connect easily with the cell’s outside, they cannot readily pass through the plasma membrane’s lipid core. Additionally, while small ions could easily slip through the spaces in the membrane’s mosaic, their charge prevents them from doing so. Ions such as sodium, potassium, calcium, and chloride must have special means of penetrating plasma membranes. Simple sugars and amino acids also need the help of various transmembrane proteins (channels) to transport themselves across plasma membranes.
Diffusion
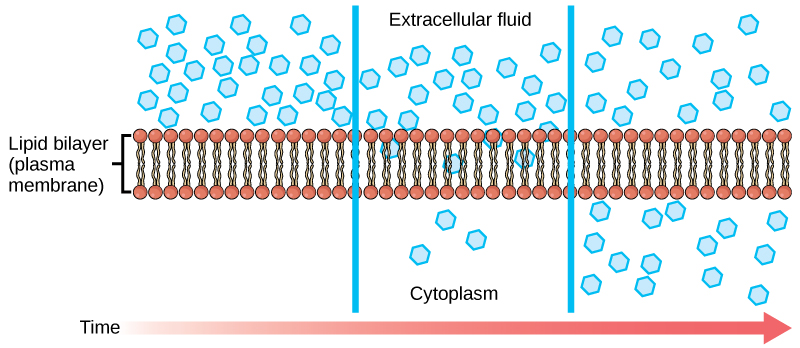
Diffusion is a passive process of transport. A single substance moves from a high concentration to a low concentration area until the concentration is equal across a space. You are familiar with diffusion of substances through the air. For example, think about someone opening a bottle of ammonia in a room filled with people. The ammonia gas is at its highest concentration in the bottle. Its lowest concentration is at the room’s edges. The ammonia vapor will diffuse, or spread away, from the bottle, and gradually, increasingly more people will smell the ammonia as it spreads. Materials move within the cell’s cytosol by diffusion, and certain materials move through the plasma membrane by simple diffusion (Figure 4.3.1). Diffusion expends no energy. On the contrary, concentration gradients are a form of potential energy, which dissipates as the gradient is eliminated.
Each separate substance in a medium, such as the extracellular fluid, has its own concentration gradient, independent of other materials’ concentration gradients. In addition, each substance will diffuse according to that gradient. Within a system, there will be different diffusion rates of various substances in the medium.
Factors That Affect Diffusion
Molecules move constantly in a random manner, at a rate that depends on their mass, their environment, and the amount of thermal energy they possess, which in turn is a function of temperature. This movement accounts for molecule diffusion through whatever medium in which they are localized. A substance moves into any space available to it until it evenly distributes itself throughout. After a substance has diffused completely through a space, removing its concentration gradient, molecules will still move around in the space, but there will be no net movement of the number of molecules from one area to another. We call this lack of a concentration gradient in which the substance has no net movement dynamic equilibrium. While diffusion will go forward in the presence of a substance’s concentration gradient, several factors affect the diffusion rate.
A variation of diffusion is the process of filtration. In filtration, material moves according to its concentration gradient through a membrane. Sometimes pressure enhances the diffusion rate, causing the substances to filter more rapidly. This occurs in the kidney, where blood pressure forces large amounts of water and accompanying dissolved substances, or solutes, out of the blood and into the renal tubules. The diffusion rate in this instance is almost totally dependent on pressure. One of the effects of high blood pressure is the appearance of protein in the urine, which abnormally high pressure “squeezes through.”
Facilitated Transport
In facilitated transport, or facilitated diffusion, materials diffuse across the plasma membrane with the help of membrane proteins. A concentration gradient exists that would allow these materials to diffuse into the cell without expending cellular energy. However, these materials are polar molecule ions that the cell membrane’s hydrophobic parts repel. Facilitated transport proteins shield these materials from the membrane’s repulsive force, allowing them to diffuse into the cell.
The transported material first attaches to protein or glycoprotein receptors on the plasma membrane’s exterior surface. This allows removal of material from the extracellular fluid that the cell needs. The substances then pass to specific integral proteins that facilitate their passage. Some of these integral proteins are collections of beta-pleated sheets that form a pore or channel through the phospholipid bilayer. Others are carrier proteins which bind with the substance and aid its passive diffusion through the membrane.
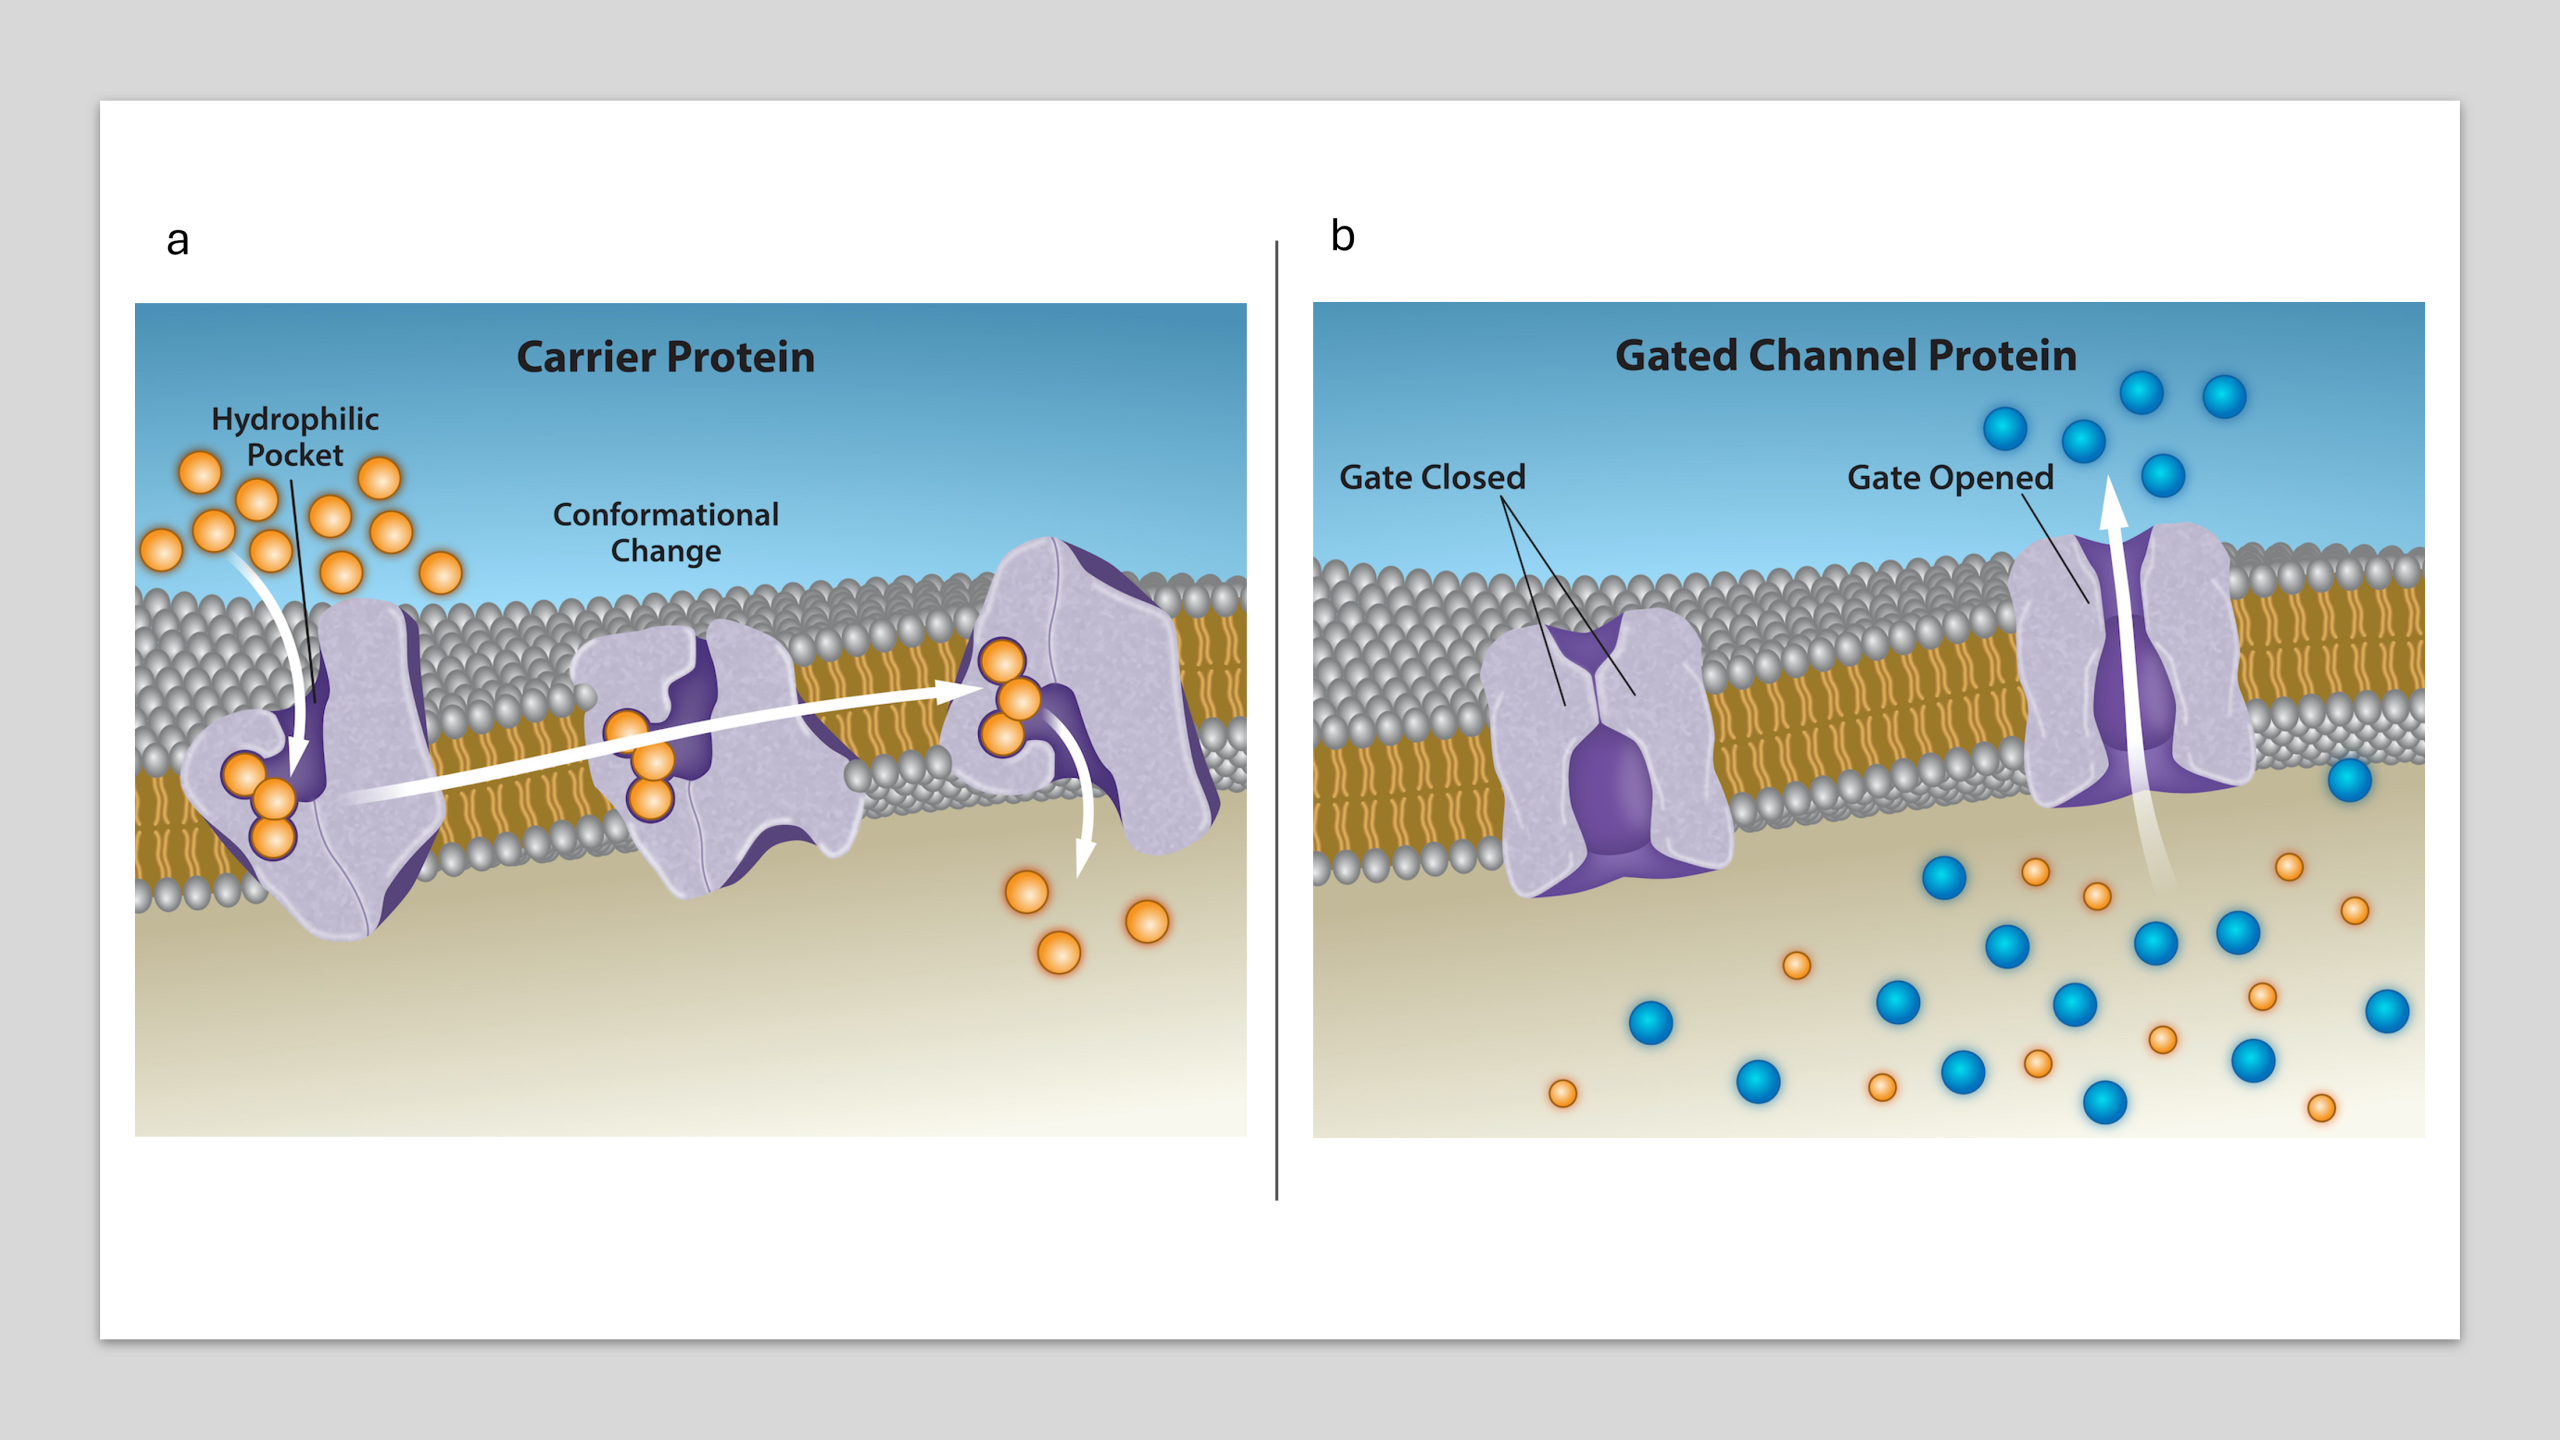
Channel and carrier proteins transport material at different rates. Channel proteins transport much more quickly than carrier proteins. Channel proteins facilitate diffusion at a rate of tens of millions of molecules per second; whereas, carrier proteins work at a rate of a thousand to a million molecules per second.
Osmosis
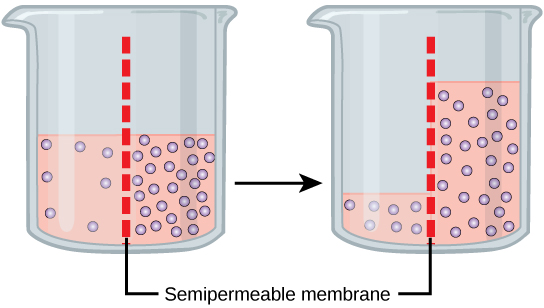
Osmosis is a special case of passive diffusion. Water, like other substances, moves from an area of high concentration of free water molecules to one of low free water molecule concentration. An obvious question is what makes water move at all? Imagine a beaker with a semipermeable membrane separating the two sides or halves (Figure 4.3.3). On both sides of the membrane the water level is the same, but there are different dissolved substance concentrations, or solutes, that cannot cross the membrane (otherwise the solute crossing the membrane would balance concentrations on each side). If the solution’s volume on both sides of the membrane is the same, but the solute’s concentrations are different, then there are different amounts of water, the solvent, on either side of the membrane. While diffusion transports material across membranes and within cells, osmosis transports only water across a membrane and the membrane limits the solutes’ diffusion in the water. Not surprisingly, the aquaporins that facilitate water movement play a large role in osmosis, most prominently in red blood cells and the membranes of kidney tubules.
To illustrate this, imagine two full water glasses. One has a single teaspoon of sugar in it; whereas, the second one contains one-quarter cup of sugar. If the total volume of the solutions in both cups is the same, which cup contains more water? Because the large sugar amount in the second cup takes up much more space than the teaspoon of sugar in the first cup, the first cup has more water in it.
Returning to the beaker example, recall that it has a solute mixture on either side of the membrane. A principle of diffusion is that the molecules move around and will spread evenly throughout the medium if they can. However, only the material capable of getting through the membrane will diffuse through it. In this example, the solute cannot diffuse through the membrane, but the water can. Water has a concentration gradient in this system. Thus, water will diffuse down its concentration gradient, crossing the membrane to the side where it is less concentrated. This diffusion of water through the membrane—osmosis—will continue until the water’s concentration gradient goes to zero or until the water’s hydrostatic pressure balances the osmotic pressure. Osmosis proceeds constantly in living systems.
Tonicity
Tonicity describes how an extracellular solution can change a cell’s volume by affecting osmosis. A solution’s tonicity often directly correlates with the solution’s osmolarity. Osmolarity describes the solution’s total solute concentration. A solution with low osmolarity has a greater number of water molecules relative to the number of solute particles. A solution with high osmolarity has fewer water molecules with respect to solute particles. In a situation in which a membrane permeable to water, though not to the solute separates two different osmolarities, water will move from the membrane’s side with lower osmolarity (and more water) to the side with higher osmolarity (and less water). This effect makes sense if you remember that the solute cannot move across the membrane, and thus the only component in the system that can move—the water—moves along its own concentration gradient. An important distinction that concerns living systems is that osmolarity measures the number of particles (which may be molecules) in a solution. Therefore, a solution that is cloudy with cells may have a lower osmolarity than a solution that is clear, if the second solution contains more dissolved molecules than there are cells.
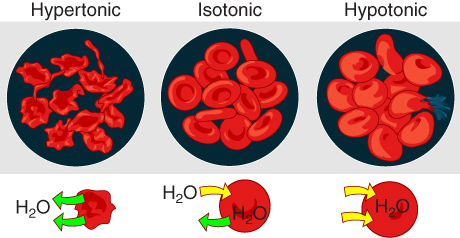
Hypertonic solutions
Scientists use three terms—hypotonic, isotonic, and hypertonic—to relate the cell’s osmolarity to the extracellular fluid’s osmolarity that contains the cells.
Tonicity in Living Systems
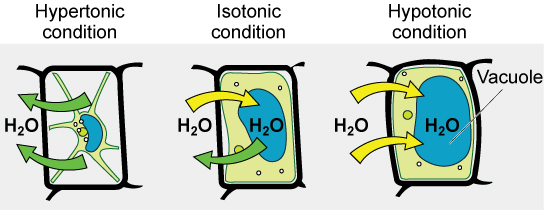
Various living things have ways of controlling the effects of osmosis—a mechanism we call osmoregulation. Some organisms, such as plants, fungi, bacteria, and some protists, have cell walls that surround the plasma membrane and prevent cell lysis in a hypotonic solution. The plasma membrane can only expand to the cell wall’s limit, so the cell will not lyse. The cytoplasm in plants is always slightly hypertonic to the cellular environment, and water will always enter a cell if water is available. This water inflow produces turgor pressure, which stiffens the plant’s cell walls (Figure 4.3.5). In nonwoody plants, turgor pressure supports the plant. Conversely, if you do not water the plant, the extracellular fluid will become hypertonic, causing water to leave the cell. In this condition, the cell does not shrink because the cell wall is not flexible. However, the cell membrane detaches from the wall and constricts the cytoplasm. We call this plasmolysis. Plants lose turgor pressure in this condition and wilt.
Many marine invertebrates have internal salt levels matched to their environments, making them isotonic with the water in which they live. Fish, however, must spend approximately 5% of their metabolic energy maintaining osmotic homeostasis. Freshwater fish live in an environment that is hypotonic to their cells. These fish actively take in salt through their gills and excrete diluted urine to rid themselves of excess water. Saltwater fish live in the reverse environment, which is hypertonic to their cells, and they secrete salt through their gills and excrete highly concentrated urine.
In vertebrates, the kidneys regulate the water amount in the body. Osmoreceptors are specialized cells in the brain that monitor solute concentration in the blood. If the solute levels increase beyond a certain range, a hormone releases that slows water loss through the kidney and dilutes the blood to safer levels. Animals also have high albumin concentrations, which the liver produces, in their blood. This protein is too large to pass easily through plasma membranes and is a major factor in controlling the osmotic pressures applied to tissues.
Practice Questions
Glossary
active transport
a form of membrane transport which moves molecules against their concentration gradient requiring energy
carrier protein
bind with a substance and aid its passive diffusion through the membrane.
channel protein
integral membrane proteins that form channels or pores in the plasma membrane, allowing specific ions or small polar molecules to pass passively through them.
concentration gradient
a physical space in which there is a single substance concentration range
facilitated diffusion
a form of passive membrane transport where substances diffuse across the plasma membrane with the help of membrane proteins from areas of high concentration to areas of low concentration
osmosis
a special case of passive diffusion that accounts for water’s movement across the plasma membrane. Can be a combination of simple and facilitated diffusion.
passive transport
a form of membrane transport which moves molecules down their concentration gradient requiring no energy
simple diffusion
the movement of a single substance from a high concentration to a low concentration area until the concentration is equal across a space, including a phospholipid bilayer.
Figure Descriptions
Figure 4.3.1. The image depicts a cross-section of a lipid bilayer, representing a plasma membrane, in a detailed diagram. The bilayer is shown in the center with two rows of circular heads (representing the hydrophilic phosphate heads) and wavy lines extending between them (representing the hydrophobic lipid tails). On both sides of the membrane, numerous small blue pentagon shapes illustrate molecules, likely indicating their movement. The left side is labeled “Extracellular fluid,” and the right side is labeled “Cytoplasm.” A horizontal red gradient arrow at the bottom represents “Time.” [Return to Figure 4.3.1]
Figure 4.3.2. Panel a illustrates a cell membrane with two gated channel proteins. The background is a gradient from blue at the top, representing the extracellular environment, to a lighter color at the bottom, indicating the intracellular space. The cell membrane is depicted as a double layer. The cross-section shows two proteins embedded within the membrane. On the left, the protein is labeled “Gate Closed” and appears with a narrow passageway, restricting movement. On the right, the protein is labeled “Gate Opened” with a wide, clear passage allowing blue spheres to pass through into the cell, denoted by a white arrow. Blue spheres are shown outside the cell, while both blue and orange spheres are scattered inside, indicating the flow through the open channel. Panel b illustrates the process of a carrier protein transporting molecules across a cell membrane. The background displays a gradient from blue at the top, symbolizing the extracellular space, to a beige color at the bottom, representing the intracellular space. The cell membrane is depicted as a double layer of grey spheres, representing phospholipids. Three stages of the transport process are shown. On the left, orange spheres representing molecules enter a purple hydrophilic pocket in the carrier protein. The central section illustrates a conformational change in the protein, as highlighted by arrows indicating the movement of molecules through the protein. On the right, molecules are released into the intracellular space, with the carrier protein returning to its original form. [Return to Figure 4.3.2]
Figure 4.3.3. The image shows two transparent beakers, each containing a pink liquid with purple dots representing solute particles. A red dashed line represents a semipermeable membrane inside both beakers. The beaker on the left has a higher concentration of solute on one side of the membrane, while the right side shows an equal distribution of solute. An arrow between the beakers indicates the movement of the solute particles and liquid across the membrane from left to right. [Return to Figure 4.3.3]
Figure 4.3.4. The image displays three circular diagrams representing the effects of three different solutions—hypertonic, isotonic, and hypotonic—on red blood cells. Each diagram consists of red blood cells against a dark background. The left diagram shows shriveled cells in a hypertonic solution, indicating water loss. The middle diagram depicts plump, smooth cells in an isotonic solution, where the water balance is equal. The right diagram illustrates swollen cells in a hypotonic solution, suggesting water gain. Below each diagram, there are smaller illustrations representing water movement: an arrow indicating water leaving the cell for hypertonic, no net movement for isotonic, and water entering the cell in hypotonic. [Return to Figure 4.3.4]
Figure 4.3.5. The image illustrates the effects of hypertonic, isotonic, and hypotonic conditions on a plant cell. On the left, the hypertonic condition showcases a shriveled cell where water (H2O) is moving out, indicated by green arrows. The cell membrane is pulled away from the cell wall. In the center, the isotonic condition displays a cell maintaining equilibrium, with equal amounts of water moving in and out, shown by green and yellow arrows. The cell is neither swollen nor shriveled. On the right, the hypotonic condition depicts a swollen cell, with a large blue vacuole as water moves into the cell, indicated by yellow arrows. The vacuole is prominently labeled. [Return to Figure 4.3.5]
Licenses and Attributions
“4.3 Passive Membrane Transport” is adapted from “5.2 Passive Transport” by Mary Ann Clark, Matthew Douglas, and Jung Choi for OpenStax Biology 2e under CC-BY 4.0. “4.3 Passive Membrane Transport” is licensed under CC-BY-NC 4.0.
Media Attributions
- 1A.B.7 Permeable membrane © Mariana Ruiz Villareal) adapted by OpenStax Biology 2e is licensed under a CC BY (Attribution) license
- 1A.B-7-Forms-of-facilitated-diffusion
- 1A.B.7 Osmosis © OpenStax Biology 2e is licensed under a CC BY (Attribution) license
- 1A.B.7 Tonicity RBC © OpenStax Anatomy and Physiology is licensed under a CC BY (Attribution) license
- Tonicity and Turgor Pressure © Mariana Ruiz Villareal) adapted by Modified by OpenStax Biology 2e is licensed under a CC BY (Attribution) license
the movement of a single substance from a high concentration to a low concentration area until the concentration is equal across a space, including a phospholipid bilayer.
a physical space in which there is a single substance concentration range
a form of passive membrane transport where substances diffuse across the plasma membrane with the help of membrane proteins from areas of high concentration to areas of low concentration
bind with a substance and aid its passive diffusion through the membrane.
a special case of passive diffusion that accounts for water's movement across the plasma membrane. Can be a combination of simple and facilitated diffusion.
