Want to create or adapt books like this? Learn more about how Pressbooks supports open publishing practices.
18.2 Using Molecular Tools in Phylogenetics
Elizabeth Dahlhoff
Learning Objectives
By the end of this section, you will be able to do the following:
Describe how DNA sequencing works.
Understand phylogenetic applications of molecular tools.
Introduction
DNA-based tools have revolutionized the fields of phylogeny and systematics, providing powerful methods to investigate evolutionary relationships among organisms. Unlike traditional approaches that rely on physical characteristics or morphology, molecular techniques analyze genetic material—most often DNA sequences—to reconstruct patterns of descent and divergence. By comparing specific genes or entire genomes, scientists can infer how closely related species are, estimate the timing of evolutionary events, and uncover hidden diversity. These methods are especially useful for resolving relationships among organisms that appear similar or that have few distinguishing physical traits. As sequencing technologies become faster and more affordable, DNA tools continue to reshape our understanding of the tree of life, making them essential for modern biological classification and evolutionary research.
Molecular Systematics
The advancement of DNA technology has given rise to molecular systematics, which is the use of molecular data in taxonomy and biological geography (biogeography). New computer programs confirm many earlier classified organisms and also uncover previously made errors. As with physical characteristics, the DNA sequence can be tricky to read in some cases. In some situations, two very closely related organisms can appear unrelated if a mutation occurred that caused a shift in the genetic code. Inserting or deleting a mutation would move each nucleotide base over one place, causing two similar codes to appear unrelated.
Sometimes two segments of DNA code in distantly related organisms randomly share a high percentage of bases in the same locations, causing these organisms to appear closely related when they are not. For both of these situations, computer technologies help identify the actual relationships, and, ultimately, the coupled use of both morphologic and molecular information is more effective in determining phylogeny.
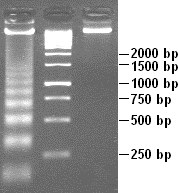
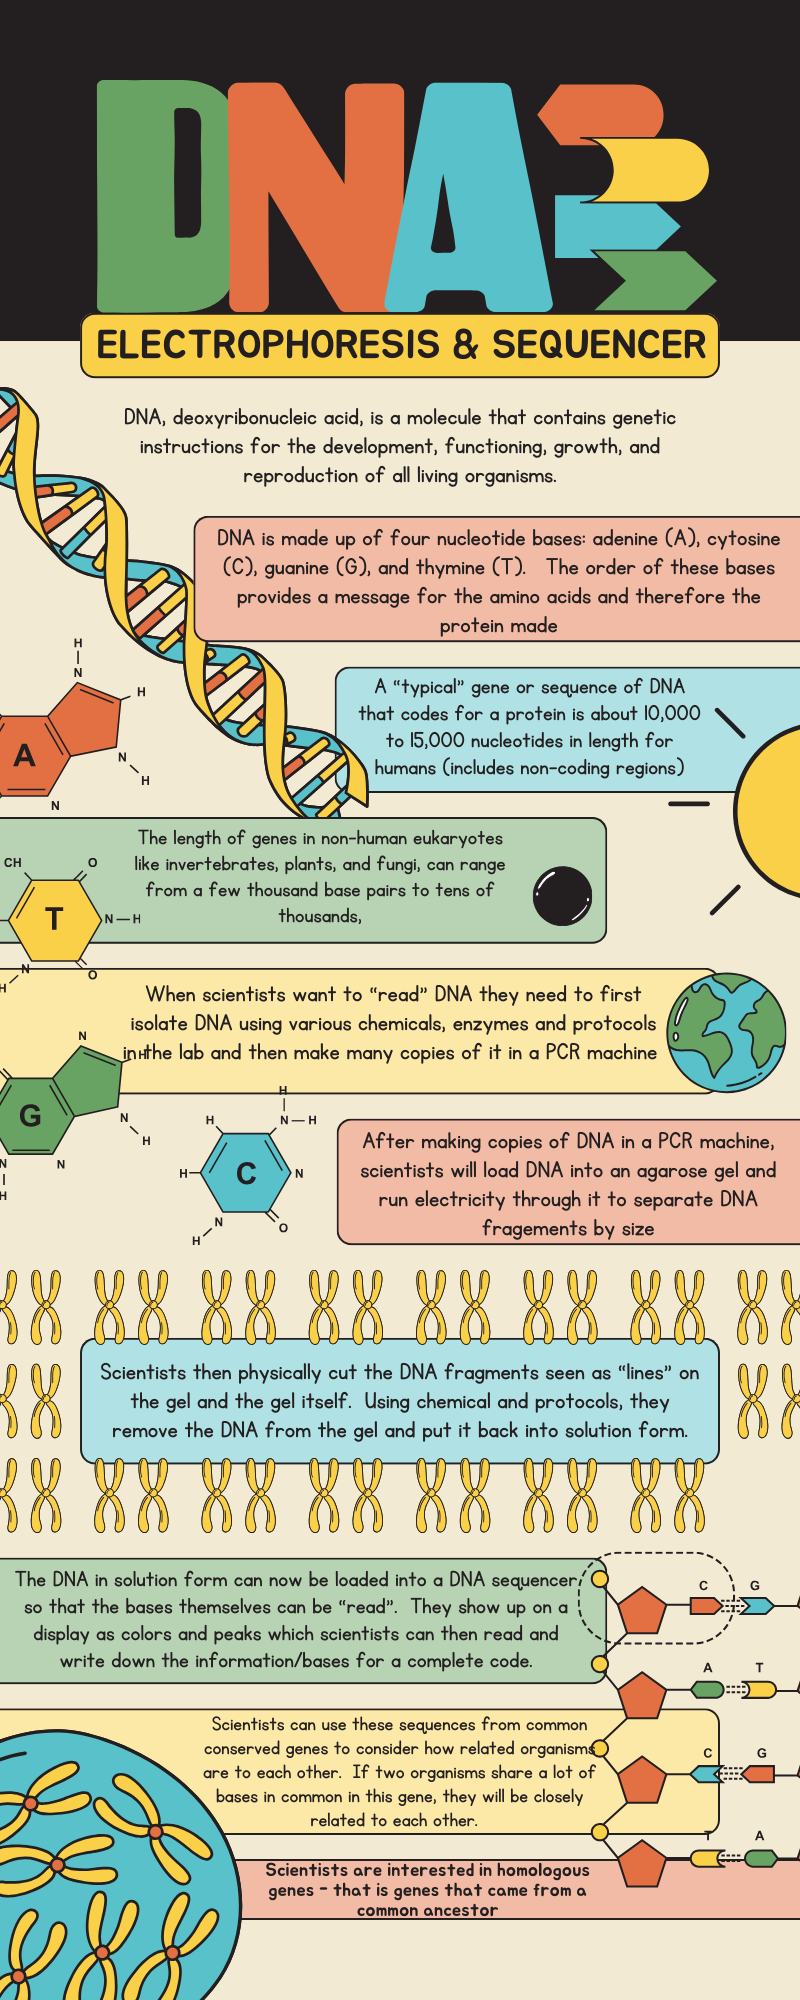
When scientists extract DNA from the cells of organisms, they can amplify it with the use of DNA technology. This means that they can take DNA and make many copies of it quickly using an instrument called a thermocycler. They can use various protocols to label DNA, cut it into fragments, and then load it into an agarose gel. The gel is a bit like Jell-O in consistency and has “wells” in it or indentations for the solution of DNA to be loaded. After scientists load this DNA into the wells that are submerged in a solution, electricity push the DNA fragments through the gel. Smaller fragments of DNA will move more quickly through a gel than longer ones so that when the electricity is turned off and the gel is stained, you can see fragments of DNA as lines on the gel (Figure 18.2.1).
Figure 18.2.1. A sample DNA gel. After running the gel, you can see different-sized fragments on this gel. The larger fragments, 2,000 bp (base pairs), are found near the top of the gel, and the smaller fragments, 250 bp, are near the bottom. (credit: Shinryuu, Public Domain/Wikimedia Commons) [Image Description]
The goal is to use these fragments to generate the sequence of bases and the code of DNA. Watch this short video to gain a perspective on this.
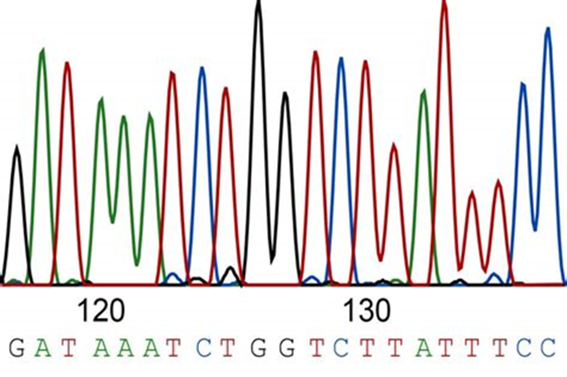
Scientists can then cut the DNA fragments of interest out of the gel and using various procedures, return the DNA into a solution. Once back into solution, scientists can run it through an instrument called a DNA sequencing machine. The instrument will “read” the DNA with a laser which lights up the labeled DNA so that different colors represent different bases of DNA. For example, the base adenine or “A” is seen as a green peak, while the base thymine or “T” is seen in red (Figure 18.2.2).
Figure 18.2.2. A sample illustration of what part of a DNA sequence would look like after being run through a DNA sequencer. The different colored peaks represent a different base, which corresponds to the sequence seen above: GATAAATCTGGTCTTATTTCC.
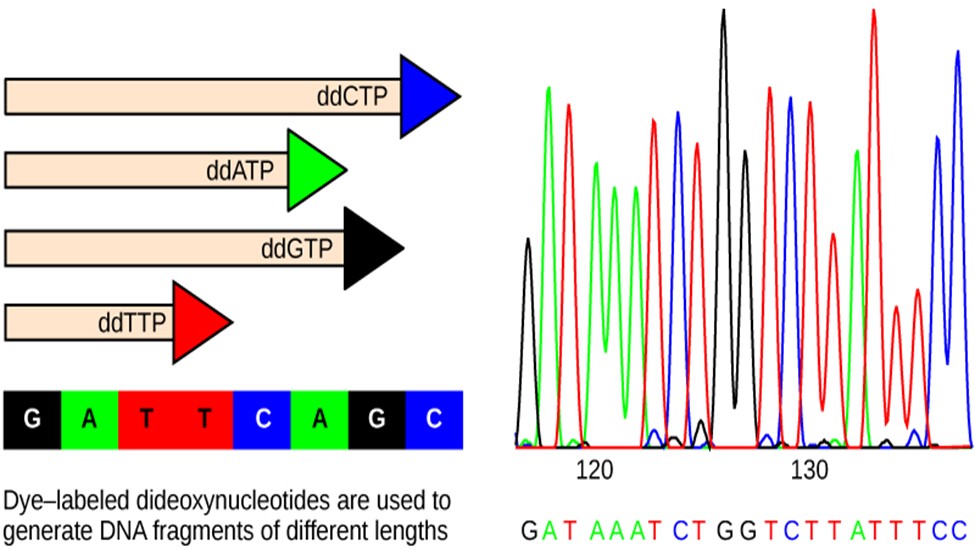
Fred Sanger developed the sequencing method used for the human genome sequencing project, which is widely used today. The sequencing method is known as the dideoxy chain termination method. Building off of what was described above, his method is based on the use of chain terminators, the dideoxynucleotides (ddNTPs). The ddNTPSs differ from the deoxynucleotides by the lack of a free 3′ OH group on the five-carbon sugar. If a ddNTP is added to a growing DNA strand, the chain cannot be extended any further because the free 3′ OH group needed to add another nucleotide is not available. By using a predetermined ratio of deoxynucleotides to dideoxynucleotides, it is possible to generate DNA fragments of different sizes.
The DNA sample to be sequenced is denatured (separated into two strands by heating it to high temperatures). The DNA is divided into four tubes in which a primer, DNA polymerase (an enzyme to help copy the DNA to make more DNA strands), and all four nucleoside triphosphates (A, T, G, and C) are added. In addition, limited quantities of one of the four dideoxynucleoside triphosphates (ddCTP, ddATP, ddGTP, and ddTTP) are added to each tube respectively. The tubes are labeled as A, T, G, and C according to the ddNTP added. For detection purposes, each of the four dideoxynucleotides carries a different fluorescent label. Chain elongation continues until a fluorescent dideoxy nucleotide is incorporated, after which no further elongation takes place. After the reaction is over, electrophoresis is performed. Even a difference in the length of a single base can be detected. The sequence is read from a laser scanner that detects the fluorescent marker of each fragment (Figure 18.2.3). For his work on DNA sequencing, Sanger received a Nobel Prize in Chemistry in 1980.
Figure 18.2.3. In Frederick Sanger’s dideoxy chain termination method, dye-labeled dideoxynucleotides are used to generate DNA fragments that terminate at different points. The DNA is separated by capillary electrophoresis (not defined) based on size, and from the order of fragments formed, the DNA sequence can be read. The DNA sequence readout is shown on an electropherogram (not defined) that is generated by a laser scanner.[Image Description]
Video 18.2.1 (also linked here) gives a quick overview of the methodology that goes into DNA sequencing using the Sanger method.Since the advent of Sanger sequencing, next-generation DNA sequencing (NGS) has further transformed the field of phylogenetics by enabling researchers to generate vast amounts of genetic data quickly and affordably. Unlike traditional Sanger sequencing, which sequences one DNA fragment at a time, NGS methods can sequence millions of fragments in parallel, producing high-throughput data for large-scale phylogenetic studies. One common approach is whole genome sequencing (WGS), which captures the entire DNA content of an organism and provides a comprehensive dataset for evolutionary comparisons. Alternatively, transcriptome sequencing (RNA-seq) focuses on the genes that are actively expressed, offering insight into evolutionary patterns in coding regions, particularly useful when a reference genome is unavailable. For more limited or specific questions, amplicon sequencing targets short, conserved gene regions (like mitochondrial COI or bacterial 16S rRNA genes), making it ideal for species identification.If you are curious, Henrik’s Lab has a very nice video explanation of NGS sequencing.No matter the method, once a sequence the exact coding of a DNA fragment, a gene, or a chromosome is determined, these data can be compared between different organisms to see how much DNA they have in common with one another. For example, scientists can isolate the enzyme cytochrome oxidase and sequence it. Cytochrome is an example of a conserved gene, which means it has changed little over evolutionary time. The protein cytochrome c (cyt c) is about 100 amino acids long and is involved with aerobic respiration (it is found in the mitochondria) to help make ATP energy. Because of its value, we expect most species to have cytochrome and that it will be similar in terms of amino acids or DNA; however, there are some differences, and this is what can help us understand phylogeny. If there are more differences, you expect less relationship between species. In other words, the fewer differences you find, the more closely related you expect the species to be to one another.
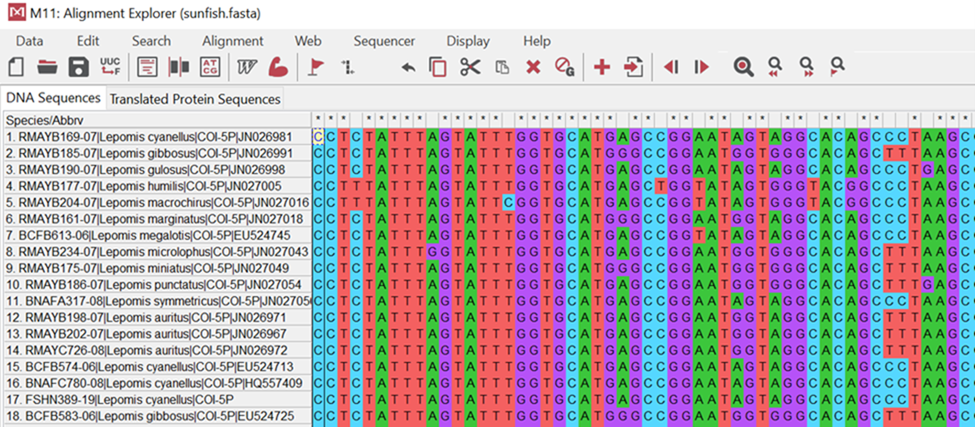
Take a look at the image below (Figure 18.2.4). It illustrates samples taken from different bony fish where the cytochrome c gene was isolated and sequenced. You will notice that colors match up in columns showing no changes. For example, the second position or base for these organisms is blue indicating “cytosine” or “C.” It is the same for all organisms. If you examine the fourth position, however, you will see mostly cytosine; however, there are two organisms (#4 & #5) that now have a red “tyrosine” or “T” base. This shows us a difference or a change in these organisms from their evolutionary past.
Figure 18.2.4. DNA sequence alignment of a portion of the cytochrome c oxidase gene for 18 species of sunfish using the MEGA software program. Individuals that are more closely related to one another should have more DNA base pairs in common.[Image Description]Figure 18.2.5. This infographic is a nice summary of how DNA sequencing works. [Accessible_DNA_Electrophoresis_and_Sequencer_Infographic – New Tab]
Step-by-Step Guide
For a great practical step by step summary for creating phylogenies from DNA sequences, check out this tutorial from the Howard Hughes Medical Institute “Click and Learn” series.
DNA technologies have revolutionized how scientists study phylogeny, the evolutionary relationships among species, and systematics, the classification of organisms. Unlike traditional methods based on morphology, molecular techniques compare DNA sequences to infer relationships, estimate divergence times, and uncover hidden biodiversity. Molecular systematics uses genetic data to build evolutionary trees, often confirming or correcting classifications based on physical traits. Techniques like PCR and gel electrophoresis allow scientists to isolate and visualize DNA fragments. These fragments can then be sequenced to determine their exact base order using methods like Sanger sequencing, which relies on special chain-terminating nucleotides. Next-generation sequencing (NGS) has dramatically increased the speed and scale of DNA analysis by allowing millions of fragments to be sequenced at once. This enables whole genome comparisons, transcriptome analysis, or targeted gene studies. Conserved genes like cytochrome c are especially useful for comparing distant species, since small changes can reflect large evolutionary distances. By aligning DNA sequences across organisms, scientists can construct phylogenetic trees that represent evolutionary histories—making DNA tools essential for modern evolutionary biology and classification.
Glossary
agarose gel
a three-dimensional matrix made of agarose, a polysaccharide derived from seaweed, that forms a porous structure when dissolved in water and cooled; this porous structure allows it to act as a medium for separating DNA fragments by size
capillary electrophoresis
technique used to separate DNA fragments by size using thin tubes filled with gel and an electric field
conserved gene gene that has remained largely unchanged throughout evolution and is shared among many species, such as mitochondrial cytochrome c 1 (CO-I)
cytochrome c (CO-I)
protein involved in cellular respiration; commonly used in phylogenetic studies due to its conserved nature across species
dideoxynucleotide (ddNTP)
nucleotide used in DNA sequencing that lacks a 3′ OH group, causing termination of DNA strand elongation
DNA sequencing
process of determining the exact order of nucleotide bases (A, T, C, G) in a DNA molecule
electrophoresis
method that uses electric current to separate DNA fragments by size through a gel matrix
genome
complete set of genetic material in an organism
gel electrophoresis
laboratory technique that separates DNA fragments by size using an electric field in a gel
molecular systematics
use of molecular (DNA or protein) data to determine evolutionary relationships and classify organisms
next-generation sequencing (NGS)
high-throughput DNA sequencing technology that can process millions of DNA fragments simultaneously
polymerase chain reaction (PCR)
technique used to amplify a segment of DNA, making millions of copies of a specific DNA sequence
primer
short DNA sequence that provides a starting point for DNA synthesis during sequencing or PCR
sequence alignment
method used to compare DNA sequences from different organisms to identify similarities and differences
Sanger sequencing
DNA sequencing method developed by Frederick Sanger that uses chain-terminating nucleotides to determine DNA sequences
Figure Descriptions
Figure 18.2.1. A vertical DNA gel with three lanes is shown. The first lane contains a DNA ladder with multiple evenly spaced bright bands corresponding to fragment sizes labeled on the right: 2,000 bp, 1,500 bp, 1,000 bp, 750 bp, 500 bp, and 250 bp. The second lane contains a bright band around the 1,000 bp marker, and the third lane contains a bright band near the 2,000 bp marker. Larger fragments are located near the top of the gel, and smaller fragments are closer to the bottom, indicating separation by size through electrophoresis. [Return to Figure 18.2.1]
Figure 18.2.3. The left panel shows four horizontal DNA strands of different lengths, each ending in a colored triangle labeled “ddCTP” (blue), “ddATP” (green), “ddGTP” (black), and “ddTTP” (red); beneath them a legend maps colors to bases—black G, green A, red T, blue C—followed by “G A T T C A G C,” and a caption line reads “Dye-labeled dideoxynucleotides are used to generate DNA fragments of different lengths.” The right panel is a chromatogram with green (A), red (T), black (G), and blue (C) peaks, position ticks at “120” and “130,” and the called sequence printed below as “G A T A A A T C T G G T C T T A T T T C C.” [Return to Figure 18.2.3]
Figure 18.2.4. This screenshot from MEGA shows an alignment of the same gene (cytochrome c oxidase, COI) from 18 sunfish species. Each row is one species/sample (name at left); each column is the same nucleotide position across all species (homologous sites). Bases are color-coded—A = green, C = blue, G = purple, T = red—so you can read patterns quickly. Columns that are a single color are conserved (no differences at that position), while columns with a mix of colors are variable sites/SNPs. Species that are more closely related will have long runs of the same colors in the same order (few mismatches) when you compare their rows; species that are more distant will show many color differences across columns. This is the raw evidence MEGA uses to compute pairwise identity and build phylogenetic trees—you can literally count the number of differing columns between two rows to estimate relatedness. [Return to Figure 18.2.4]
