12.3 Case Study: Lunchtime!
ttan2

Lunchtime is the favorite class of the day for many schoolchildren. After a long day in Mr. Kitumaini’s science class, 12-year-old LaKiesha Washington and her four friends head out to the cafeteria to feast! Consider the following meals that the children are eating.
| Student Names | Lunches | % Animal Product | % Plant Product |
|---|---|---|---|
| LaKiesha Washington | Garden salad | 0 | 100 |
| Amir Ansari | Halal butter paneer (Indian cheese) | 10 | 90 |
| Maria Flores | Tuna salad | 25 | 75 |
| Haruto Watanabe | Saba (mackerel) sushi | 25 | 75 |
| Charlotte Green | Meat lover’s pizza | 75 | 25 |
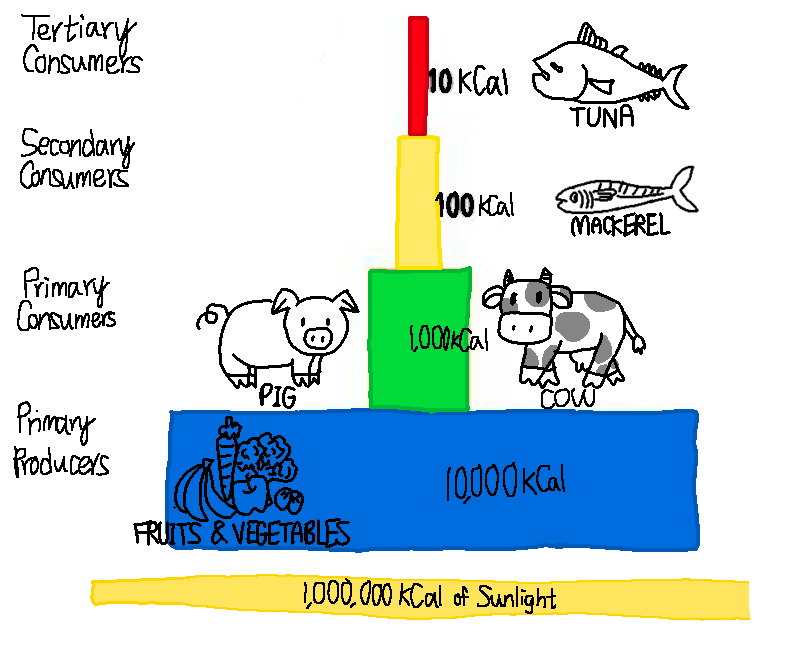
Knowing the trophic level of the food that is being consumed is important to calculating the solar energy needed to produce that food. Please use Figure 12.3.2 to determine the trophic level of the food source.
Step-by-Step Instructions
How much sunlight energy is required for Charlotte to derive energy from the diet she is consuming?
Here are the steps we will use to solve this problem.
Total Kcal per day * 10# of trophic levels the food is in * 100(fraction of sunlight energy)
Step 1: Because Charlotte’s diet is both meat and plants, we need to treat those two parts separately. The meat that Charlotte eats all comes from primary consumers, which are at trophic level 2, and the plants are all primary producers which is trophic level 1.
Charlotte’s diet consists of 75% meat at the primary consumer level. To determine how much sunlight energy is required for her to derive energy from the meat that she is consuming, we must do the following calculation:
2000 kcal (0.75) * 10 * 10 * 100 = 1.5 x 10⁷ kcal of sunlight needed
Step 2: To determine how much sunlight energy is required for the plants that she is consuming, we must do the following calculation:
2000 kcal (0.25) * 10 * 100 = 5 x 10⁵ kcal of sunlight needed
So, in total, her meals require 1.505 x 10⁷ kcal of sunlight.
Practice Questions
Figure Description
Figure 12.3.2. This diagram presents a simplified trophic pyramid to illustrate energy transfer across trophic levels, starting with 1,000,000 kilocalories (kCal) of sunlight at the base. Primary producers, represented by fruits and vegetables, retain 10,000 kCal of energy. Primary consumers—depicted as a cow and a pig—receive 1,000 kCal. The pig is classified here as an herbivore for instructional purposes. Secondary consumers, represented by a mackerel, receive 100 kCal, and the tertiary consumer, a tuna, retains only 10 kCal. The pyramid visually emphasizes the sharp decrease in available energy as one moves up trophic levels in the food chain. [Return to Figure 12.3.2]
Media Attributions
- Lunchtime! : A Case Study in Ecological Efficiency © Tianyu Tan is licensed under a CC BY-NC (Attribution NonCommercial) license
- Trophic Levels © Tianyu Tan is licensed under a CC BY-NC (Attribution NonCommercial) license
