12.1 Ecosystems, Food Chains, and Food Webs
Learning Objectives
By the end of this section, you will be able to do the following:
- Describe the basic ecosystem types.
- Differentiate between food chains and food webs and recognize the importance of each.
Ecosystem Types
Life in an ecosystem is often about competition for limited resources, a characteristic of the theory of natural selection. Competition in communities (all living things within specific habitats) is observed both within species and among different species. The resources for which organisms compete include organic material, sunlight, and mineral nutrients, which provide the energy for living processes and the matter to make up organisms’ physical structures. Other critical factors influencing community dynamics are the components of its physical and geographic environment: a habitat’s latitude, amount of rainfall, topography (elevation), and available species. These are all important environmental variables that determine which organisms can exist within a particular area.
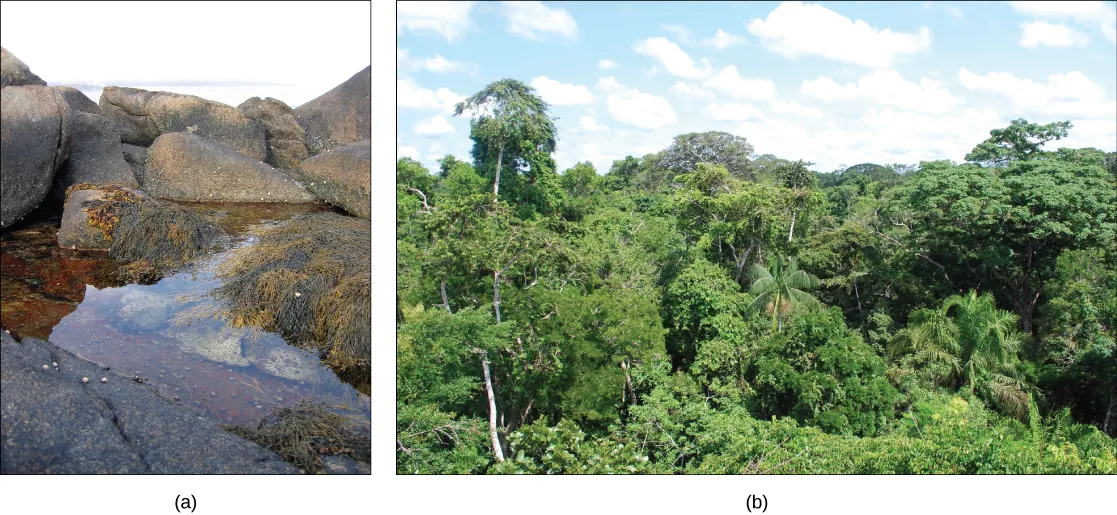
An ecosystem is a community of living organisms and their interactions with their abiotic (nonliving) environment. Ecosystems can be small, such as the tide pools found near the rocky shores of many oceans, or large, such as the Amazon Rainforest in Brazil (Figure 12.1.1).
There are three broad categories of ecosystems based on their general environment: freshwater, ocean water, and terrestrial. Within these broad categories are individual ecosystem types based on the organisms present and the type of environmental habitat.
Ocean ecosystems are the most common, comprising over 70% of the Earth’s surface and consisting of three basic types: shallow ocean, deep ocean water, and deep ocean surfaces (the low depth areas of the deep oceans). The shallow ocean ecosystems include extremely biodiverse coral reef ecosystems, and the deep ocean surface is known for its large numbers of plankton and krill (small crustaceans) that support it. These two environments are especially important to aerobic respirators worldwide as the phytoplankton perform 40% of all photosynthesis on Earth. Although not as diverse as the other two, deep ocean ecosystems contain a wide variety of marine organisms. Such ecosystems exist even at the bottom of the ocean where light is unable to penetrate through the water.
Freshwater ecosystems are the rarest, occurring on only 1.8% of the Earth’s surface. Lakes, rivers, streams, and springs comprise these systems. They are quite diverse, and they support a variety of fish, amphibians, reptiles, insects, phytoplankton, fungi, and bacteria.
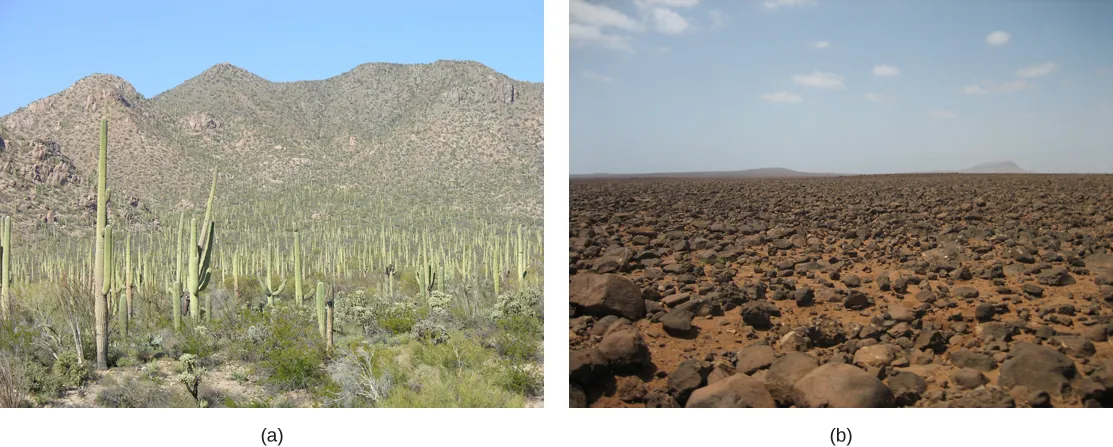
Terrestrial ecosystems, also known for their diversity, are grouped into large categories called biomes, such as tropical rain forests, savannas, deserts, coniferous forests, deciduous forests, and tundra. Grouping these ecosystems into just a few biome categories obscures the great diversity of the individual ecosystems within them. For example, there is great variation in desert vegetation: the saguaro cacti and other plant life in the Sonoran Desert in the United States are relatively abundant compared to the desolate rocky desert of Boa Vista, an island off the coast of Western Africa (Figure 12.1.2).
Ecosystems are complex with many interacting parts. They are routinely exposed to various disturbances, or changes in the environment that effect their compositions such as yearly variations in rainfall and temperature. Many of these perturbations result from natural processes. For example, when lightning causes a forest fire and destroys part of a forest ecosystem, the ground is eventually populated by grasses, then by bushes and shrubs, and later by mature trees, restoring the forest to its former state. The impact of environmental perturbations caused by human activities is as important as the changes wrought by natural processes. Human agricultural practices, air pollution, acid rain, global deforestation, overfishing, eutrophication, oil spills, and waste dumping on land and into the ocean are all issues of concern to conservationists.
Equilibrium is the steady state of an ecosystem where all organisms are in balance with their environment and with each other. In ecology, two parameters are used to measure changes in ecosystems: resistance and resilience. Resistance is the ability of an ecosystem to remain at equilibrium in spite of disturbances. Resilience is the speed at which an ecosystem recovers equilibrium after being disturbed. Ecosystem resistance and resilience are especially important when considering human impact. The nature of an ecosystem may change to such a degree that it can lose its resilience entirely. This process can lead to the complete destruction or irreversible altering of the ecosystem.
Food Chains and Food Webs
The term “food chain” is sometimes used metaphorically to describe human social situations. Individuals who are considered successful are seen as being at the top of the food chain, consuming all others for their benefit, whereas the less successful are seen as being at the bottom.
The scientific understanding of a food chain is more precise than in its everyday usage. In ecology, a food chain is a linear sequence of organisms through which nutrients and energy pass: primary producers, primary consumers, and higher-level consumers are used to describe ecosystem structure and dynamics. There is a single path through the chain. Each organism in a food chain occupies what is called a trophic level. Depending on their role as producers or consumers, species or groups of species can be assigned to various trophic levels.
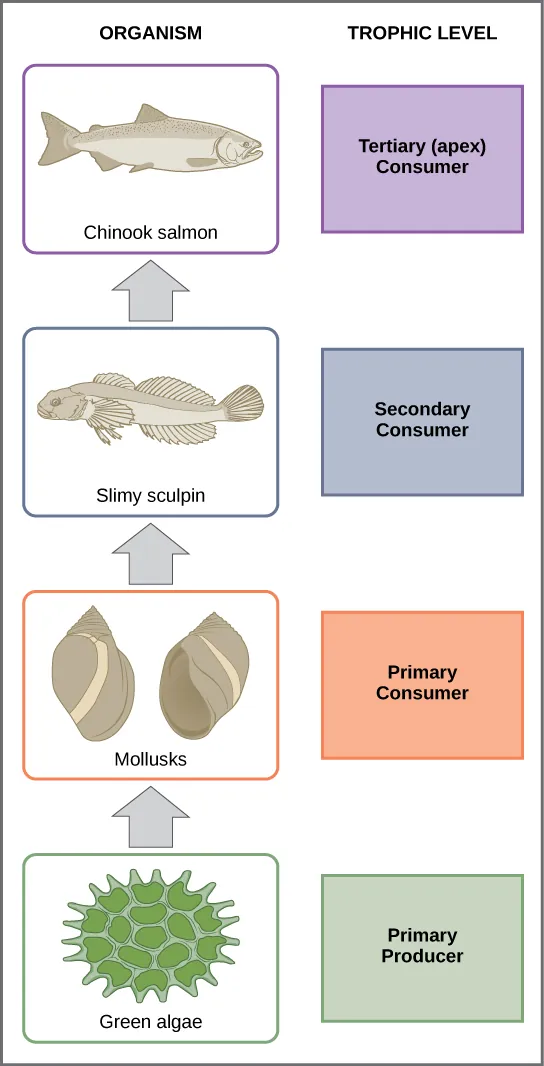
In many ecosystems, the bottom of the food chain consists of photosynthetic organisms (plants and/or phytoplankton), which are called primary producers. The organisms that consume the primary producers are herbivores: the primary consumers. an organism that feeds on primary consumers. Secondary consumers are usually carnivores that eat the primary consumers. Tertiary consumers are carnivores that eat other carnivores. Higher-level consumers feed on the next lower trophic levels, and so on, up to the organisms at the top of the food chain: the apex consumers. In the Lake Ontario food chain shown in Figure 12.1.3, the Chinook salmon is the apex consumer at the top of this food chain.
One major factor that limits the length of food chains is energy. Energy is lost as heat between each trophic level due to the second law of thermodynamics. Thus, after a limited number of trophic energy transfers, the amount of energy remaining in the food chain may not be great enough to support viable populations at yet a higher trophic level.
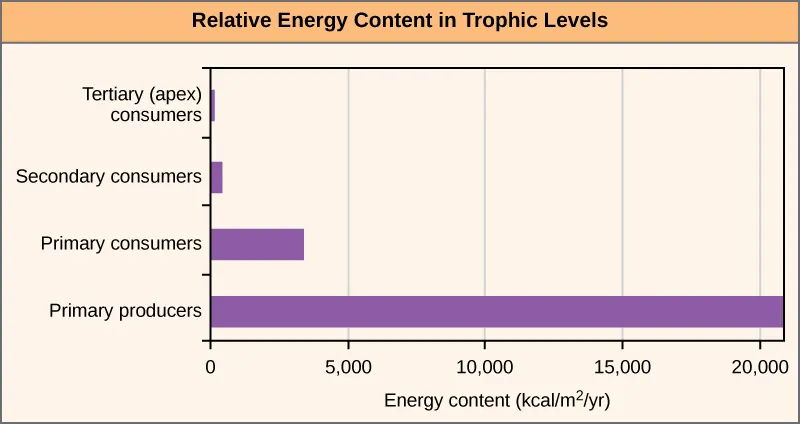
The loss of energy between trophic levels is illustrated by the pioneering studies of Howard T. Odum in the Silver Springs, Florida, ecosystem in the 1940s (Figure 12.1.4). The primary producers generated 20,819 kcal/m2/yr (kilocalories per square meter per year), the primary consumers generated 3368 kcal/m2/yr, the secondary consumers generated 383 kcal/m2/yr, and the tertiary consumers only generated 21 kcal/m2/yr. Thus, there is little energy remaining for another level of consumers in this ecosystem.
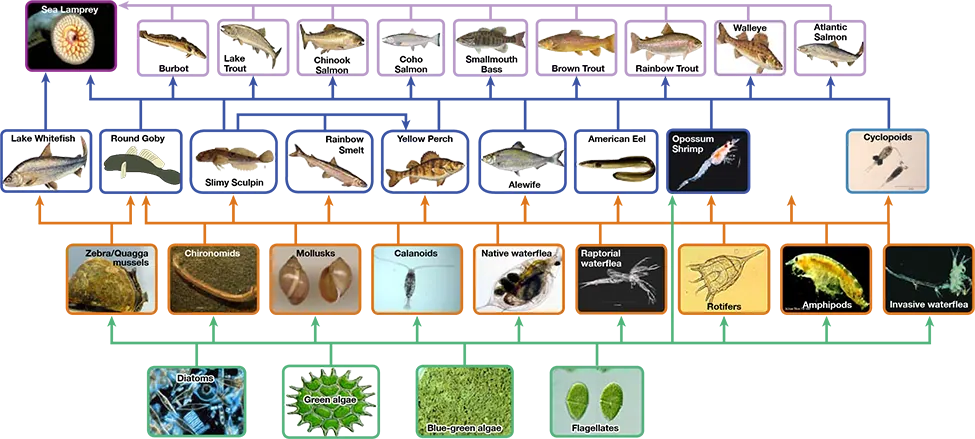
There is one problem when using food chains to accurately describe most ecosystems. Even when all organisms are grouped into appropriate trophic levels, some of these organisms can feed on species from more than one trophic level; likewise, some of these organisms can be eaten by species from multiple trophic levels. In other words, the linear model of ecosystems, the food chain, is not completely descriptive of ecosystem structure. A holistic model—which accounts for all the interactions between different species and their complex interconnected relationships with each other and with the environment—is a more accurate and descriptive model for ecosystems. A food web is a graphic representation of a holistic, nonlinear web of primary producers, primary consumers, and higher-level consumers used to describe ecosystem structure and dynamics (Figure 12.1.5).
A comparison of the two types of structural ecosystem models shows strength in both. Food chains are more flexible for analytical modeling, are easier to follow, and are easier to experiment with, whereas food web models more accurately represent ecosystem structure and dynamics, and data can be directly used as input for simulation modeling.
Practice Questions
Glossary
ecosystem
biological community consisting of living organisms and their physical environment
food chain
hierarchical series of organisms who depend on each other for food
food web
system of interlocking and interdependent food chains
primary producer
organism that makes its own food from light
primary consumer
organism that feeds on consumers
secondary consumer
organism that feeds on primary consumers
tertiary consumer
organism that feeds on secondary consumers
Figure Descriptions
Figure 12.1.1. A two panel image showing two distinct ecosystems. Panel A shows a tide pool surrounded by rocks and is an example of a small ecosystem. Panel B shows a vast and dense forest with many different types of trees and is an example of a large ecosystem. [Return to Figure 12.1.1]
Figure 12.1.2. A two panel image showing two distinct examples of a desert ecosystem. Panel A shows a landscape filled with saguaro cacti and small shrubs in the foreground and mountains in the background also covered with plants. Panel B shows a rocky landscape with very little plant life. [Return to Figure 12.1.2]
Figure 12.1.3. This vertical diagram shows the trophic levels of a food chain in Lake Ontario, moving from the bottom (primary producer) to the top (tertiary consumer). On the left side, a column titled “Organism” lists and depicts each species; on the right side, a column titled “Trophic Level” categorizes each organism’s ecological role. At the base is green algae, labeled as the Primary Producer. Above that are mollusks, labeled as Primary Consumer, which feed on the algae. Next is the slimy sculpin, labeled as a Secondary Consumer, which eats the mollusks. At the top is the Chinook salmon, labeled as the Tertiary (apex) Consumer, which preys on the slimy sculpin. Arrows between the organisms indicate the upward flow of energy and nutrients through the food chain, consistent with trophic structure. The diagram visually supports the caption’s explanation that energy begins with photosynthetic algae and moves up to the top predator, the Chinook salmon. [Return to Figure 12.1.3]
Figure 12.1.4. This horizontal bar graph is titled “Relative Energy Content in Trophic Levels” and shows energy content in different trophic levels in a Silver Springs, Florida, ecosystem. The x-axis represents energy content in kilocalories per square meter per year (kcal/m²/yr), ranging from 0 to 20,000. The y-axis lists trophic levels from bottom to top as: Primary producers, Primary consumers, Secondary consumers, and Tertiary (apex) consumers. The graph shows a large purple bar for Primary producers, reaching just under 20,000 kcal/m²/yr. Primary consumers show a much smaller bar, around 3,000 kcal/m²/yr. Secondary consumers have an even smaller bar, and Tertiary consumers have the smallest bar, barely visible in comparison. The visual clearly demonstrates the rapid drop in energy available at each ascending trophic level, supporting the caption’s point that higher levels support fewer organisms due to reduced energy availability. [Return to Figure 12.1.4]
Figure 12.1.5. This diagram shows a food web representing trophic interactions among aquatic organisms in the Lake Ontario ecosystem. Organisms are organized into four trophic levels, each outlined with a different color: green for primary producers, orange for primary consumers, blue for secondary consumers, and purple for tertiary (apex) consumers. The bottom level of the illustration (outlined in green) shows primary producers, which include diatoms, green algae, blue-green algae, and flagellates. The next level (outlined in orange) includes the primary consumers that eat primary producers. These invertebrates include zebra/quagga mussels, chironomids, mollusks, calanoids, native waterfleas, raptorial waterfleas, rotifers, amphipods, and invasive waterfleas. Primary consumers are in turn eaten by secondary consumers, (outlined in blue) which include fish like alewife, emerald shiner, rainbow smelt, round goby, and invertebrates like opossum shrimp and cyclopoids. The small fish are eaten by larger fish, the tertiary, or apex consumers, including sea lamprey, lake trout, Atlantic salmon, Chinook and coho salmon, brown trout, burbot, and walleye. Finally, all fish are eaten by the sea lamprey. Arrows indicate the direction of energy flow from the organism being consumed to the one consuming it. For the most part, every organism at a given level eats every organism in the level below and nothing else, but there are exceptions. For example, not all secondary consumers eat all primary consumers. Lake whitefish only eat zebra and quagga mussels, round goby eat all primary consumers, and the other secondary consumers eat every primary consumer except for the zebra and quagga mussels. The secondary consumer yellow perch eats two other secondary consumers from its own level, the slimy sculpin and the rainbow smelt, in addition to eating primary consumers from the level below. Some organisms can also skip a level. The secondary consumer opossum shrimp eats most primary consumers in the level immediately below and all of the primary producers two levels below. Sea lamprey eat all tertiary and secondary consumers. Thus, the food web is complex with interwoven layers. [Return to Figure 12.1.5]
Licenses and Attributions
“12.1 Ecosystems, Food Chains, and Food Webs” is adapted from “46.1 Ecology of Ecosystems” by Mary Ann Clark, Matthew Douglas, and Jung Choi for OpenStax Biology 2e under CC-BY 4.0. “12.1 Ecosystems, Food Chains, and Food Webs” is licensed under CC-BY-NC 4.0.
Media Attributions
- Ecosystems © (credit a: modification of work by “takomabibelot”/Flickr; credit b: modification of work by Ivan Mlinaric) adapted by OpenStax is licensed under a CC BY-SA (Attribution ShareAlike) license
- Desert Ecosystems © (credit a: modification of work by Jay Galvin; credit b: modification of work by Ingo Wölbern) adapted by OpenStax is licensed under a CC BY-SA (Attribution ShareAlike) license
- 1A.D.12 Lake Ontario trophic levels © OpenStax is licensed under a CC BY-SA (Attribution ShareAlike) license
- 1A.D.12 Energy in trophic levels © OpenStax is licensed under a CC BY-SA (Attribution ShareAlike) license
- 1A.D.12 Lake Ontario food web © OpenStax is licensed under a CC BY-SA (Attribution ShareAlike) license
all the living things in a particular area together with the abiotic, nonliving parts of that environment
A hierarchical series of organisms each dependent on the next as a source of food.
An organism that makes its own food from light or chemical energy
An organism that feeds on producers
An organism that feeds on primary consumers
an organism that eats secondary consumers
A system of interlocking and interdependent food chains.
