10.2 Glycolysis
Learning Objectives
By the end of this section, you will be able to do the following:
- Describe the overall result in terms of molecules produced during the chemical breakdown of glucose by glycolysis.
- Compare the output of glycolysis in terms of ATP molecules and NADH molecules produced.
As you have read, nearly all of the energy used by living cells comes to them in the bonds of the sugar glucose. Glycolysis is the first step in the breakdown of glucose to extract energy for cellular metabolism. In fact, nearly all living organisms carry out glycolysis as part of their metabolism. The process does not use oxygen directly and therefore is termed anaerobic. Glycolysis takes place in the cytoplasm of both prokaryotic and eukaryotic cells. Glucose enters non-photosynthetic cells in two ways. One method is through secondary active transport in which the transport takes place against the glucose concentration gradient. The other mechanism uses a group of integral proteins called GLUT proteins, also known as glucose transporter proteins. These transporters assist in the facilitated diffusion of glucose into the cells where it is quickly modified by the first glycolysis enzyme. For a review of membrane transport principles, revisit Section 4.3 and Section 4.4.
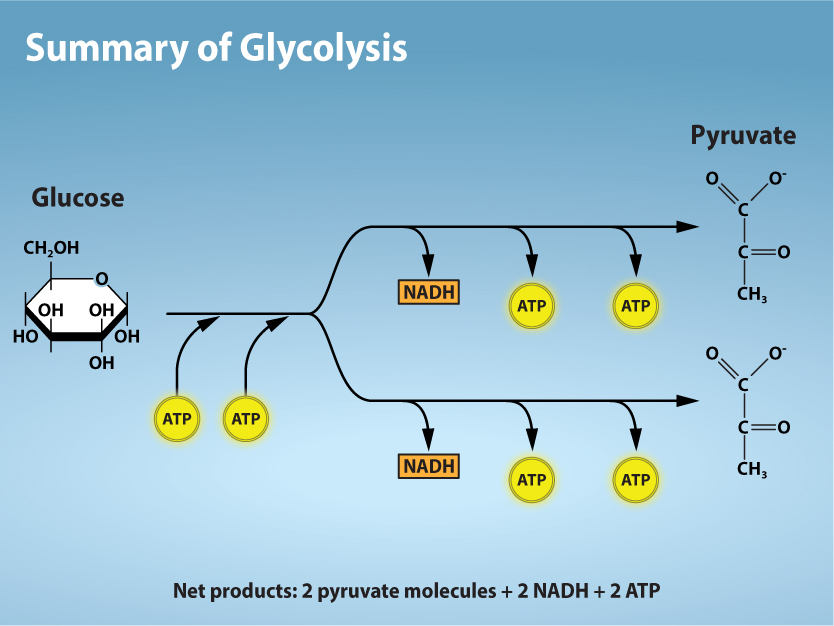
Glycolysis begins with the six-carbon ring-shaped structure of a single glucose moleculeATP and ends with two molecules of a three-carbon sugar called pyruvate. Glycolysis consists of two distinct phases. The first part of the glycolysis pathway traps the glucose molecule in the cell and uses energy to modify it so that the six-carbon sugar molecule can be split evenly into the two three-carbon molecules. The second part of glycolysis extracts energy from the molecules and stores it in the form of ATP and NADH.
First Half of Glycolysis (Energy-Requiring Steps)
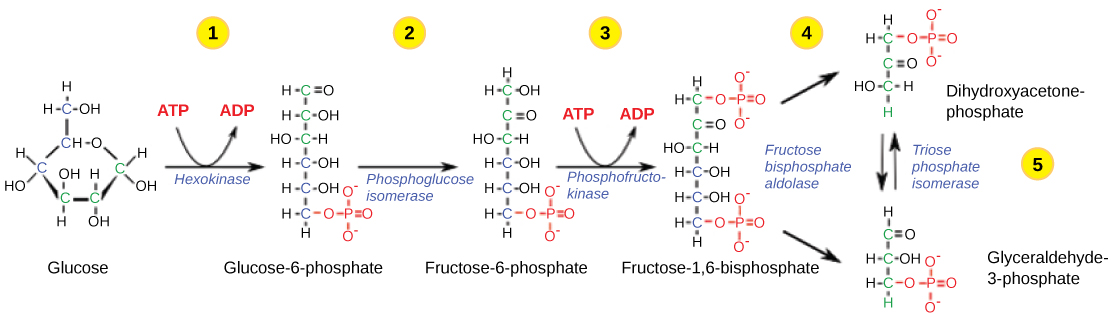
Step 1. Glucose is a very stable molecule, so in the first five steps of glycolysis, energy must be invested to destabilize the molecule and ultimately break it up from a six-carbon sugar to two three-carbon sugar molecules. First, the enzyme hexokinase phosphorylates glucose using ATP as the source of the phosphate, producing glucose-6-phosphate, a more reactive form of glucose (Figure 10.2.2).
Step 2. In the second step of glycolysis, an isomerase converts glucose-6-phosphate into one of its isomers, fructose-6-phosphate. An isomerase is an enzyme that catalyzes the conversion of a molecule into one of its isomers. (This change from phosphoglucose to phosphofructose allows the eventual split of the sugar into two three-carbon molecules.)
Step 3. The third step is the phosphorylation of fructose-6-phosphate, catalyzed by the enzyme phosphofructokinase. A second ATP molecule donates a high-energy phosphate to fructose-6-phosphate, producing fructose-1,6-bisphosphate.
Step 4. The newly added high-energy phosphates further destabilize fructose-1,6-bisphosphate. The fourth step in glycolysis employs an enzyme, aldolase, to cleave fructose-1,6-bisphosphate into two three-carbon isomers: dihydroxyacetone phosphate and glyceraldehyde-3-phosphate.
Step 5. In the fifth step, an isomerase transforms the dihydroxyacetone-phosphate into its isomer, glyceraldehyde-3-phosphate, which you might recall is the product of the Calvin Cycle in photosynthesis (link to Calvin Cycle chapter). Thus, the pathway will continue with two molecules of a glyceraldehyde-3-phosphate (G3P). At this point in the pathway, there is a net investment of energy from two ATP molecules in the breakdown of one glucose molecule.
Second Half of Glycolysis (Energy-Releasing Steps)
So far, glycolysis has cost the cell two ATP molecules and produced two small, three-carbon sugar molecules. Both of these molecules will proceed through the second half of the pathway, and sufficient energy will be extracted to pay back the two ATP molecules used as an initial investment and produce a profit for the cell of two additional ATP molecules and two even higher-energy NADH molecules.
Step 6. The sixth step in glycolysis (Figure 10.2.3) oxidizes the sugar (glyceraldehyde-3-phosphate), extracting high-energy electrons, which are picked up by the electron carrier NAD+, producing NADH. The sugar is then phosphorylated by the addition of a second phosphate group, producing 1,3-bisphosphoglycerate. Note that the second phosphate group does not require another ATP molecule.
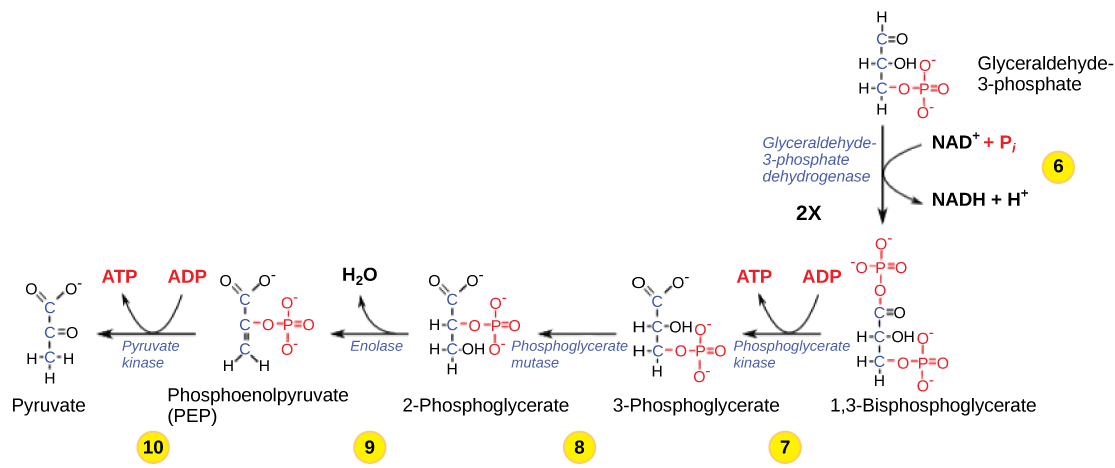
Step 7. In the seventh step, catalyzed by phosphoglycerate kinase (an enzyme named for the reverse reaction), 1,3-bisphosphoglycerate donates a high-energy phosphate to ADP, forming one molecule of ATP. (This is an example of substrate-level phosphorylation.) A carbonyl group on the 1,3-bisphosphoglycerate is oxidized to a carboxyl group, and 3-phosphoglycerate is formed.
Step 8. In the eighth step, the remaining phosphate group in 3-phosphoglycerate moves from the third carbon to the second carbon, producing 2-phosphoglycerate (an isomer of 3-phosphoglycerate). The enzyme catalyzing this step is a mutase (isomerase).
Step 9. Enolase catalyzes the ninth step. This enzyme causes 2-phosphoglycerate to lose water from its structure; this is a dehydration reaction, resulting in the formation of a double bond that increases the potential energy in the remaining phosphate bond and produces phosphoenolpyruvate (PEP).
Step 10. The last step in glycolysis is catalyzed by the enzyme pyruvate kinase (the enzyme in this case is named for the reverse reaction of pyruvate’s conversion into PEP) and results in the production of a second ATP molecule by substrate-level phosphorylation and the compound pyruvic acid (or its salt form, pyruvate). Many enzymes in enzymatic pathways are named for the reverse reactions, since the enzyme can catalyze both forward and reverse reactions (these may have been described initially by the reverse reaction that takes place in vitro, under nonphysiological conditions).
The NADH-producing step in glycolysis (step 6) is a potential limiting factor for this pathway. The continuation of the reaction depends upon the availability of the oxidized form of the electron carrier, NAD+. Thus, NADH must be continuously oxidized back into NAD+ in order to keep this step going. If NAD+ is not available, the second half of glycolysis slows down or stops. If oxygen is available in the system, the NADH will be oxidized readily, though indirectly, and the high-energy electrons from the hydrogen released in this process will be used to produce ATP. In an environment without oxygen, an alternate pathway (fermentation) can provide the oxidation of NADH to NAD+. We’ll explore this further in 7.5 Fermentation.
Outcomes of Glycolysis
Glycolysis begins with glucose and produces two pyruvate molecules, four new ATP molecules, and two molecules of NADH. (Note: two ATP molecules are used in the first half of the pathway to prepare the six-carbon ring for cleavage, so the cell has a net gain of two ATP molecules and two NADH molecules for its use). If the cell cannot catabolize the pyruvate molecules further, it will harvest only two ATP molecules from one molecule of glucose. Mature mammalian red blood cells do not have mitochondria and thus are not capable of aerobic respiration—the process in which organisms convert energy in the presence of oxygen—and glycolysis is their sole source of ATP. If glycolysis is interrupted, these cells lose their ability to maintain their sodium-potassium pumps, and eventually, they die.
Video 10.2.1. Glycolysis | HHMI BioInteractive Video by biointeractive
Practice Questions
Glossary
glycolysis
first step in the breakdown of glucose to extract energy for cellular metabolism
pyruvate
three-carbon sugar that serves as the end product of glycolysis
isomerase
enzyme that catalyzes the conversion of a molecule into one of its isomers
Figure Descriptions
Figure 10.2.1. The image is a diagram titled “Summary of Glycolysis” and is set against a gradient blue background. On the left, there’s a structural representation of a glucose molecule labeled “Glucose,” which shows its chemical structure with hydroxyl groups. Arrows point from the glucose molecule through a series of reactions represented by horizontal black lines branching out into two pathways. Each pathway includes a yellow circle labeled “ATP” and an orange box labeled “NADH,” indicating the formation of energy carrier molecules. The pathways conclude on the right with a simplified chemical diagram labeled “Pyruvate,” illustrating pyruvate molecules. At the bottom of the image, a note specifies the net products: “2 pyruvate molecules + 2 NADH + 2 ATP.” [Return to Figure 10.2.1]
Figure 10.2.2. This image illustrates the first half of glycolysis in five sequential steps, with molecular structures, enzyme names, and chemical reactions labeled throughout. In step 1, glucose is shown as a ring-shaped molecule with labeled carbon, hydrogen, and hydroxyl groups. An arrow labeled “Hexokinase” points to the next molecule, and above the arrow, ATP is converted to ADP, indicating the phosphorylation of glucose. In step 2, the resulting molecule is glucose-6-phosphate, which is converted to fructose-6-phosphate via an arrow labeled “Phosphoglucose isomerase.” Step 3 shows fructose-6-phosphate being phosphorylated again by ATP, with the arrow labeled “Phosphofructokinase” and the ATP-to-ADP conversion again indicated above the arrow. This produces fructose-1,6-bisphosphate. In step 4, fructose-1,6-bisphosphate is split into two three-carbon molecules by the enzyme aldolase. The two products are dihydroxyacetone phosphate and glyceraldehyde-3-phosphate. Step 5 shows an arrow labeled “Triose phosphate isomerase,” which interconverts dihydroxyacetone phosphate and glyceraldehyde-3-phosphate. The diagram uses red font to label phosphate groups (P), ATP, and ADP, and black arrows indicate the progression of reactions. The caption explains that this first half of glycolysis uses two ATP molecules in the phosphorylation of glucose, which is then split into two three-carbon molecules. [Return to Figure 10.2.2]
Figure 10.2.3. This image depicts the second half of glycolysis in six numbered steps (6 through 10), showing how the three-carbon molecule glyceraldehyde-3-phosphate is further processed to ultimately form pyruvate, producing ATP and NADH. In step 6, glyceraldehyde-3-phosphate is oxidized and phosphorylated using inorganic phosphate (Pi), forming 1,3-bisphosphoglycerate. This step is catalyzed by the enzyme glyceraldehyde-3-phosphate dehydrogenase and produces NADH and H⁺ from NAD⁺. The image notes that this reaction occurs twice (2X), once for each of the two three-carbon molecules produced earlier. In step 7, 1,3-bisphosphoglycerate donates a phosphate group to ADP to form ATP and 3-phosphoglycerate, catalyzed by phosphoglycerate kinase. Step 8 converts 3-phosphoglycerate into 2-phosphoglycerate via phosphoglycerate mutase. Step 9 shows 2-phosphoglycerate being dehydrated (losing H₂O) by the enzyme enolase to form phosphoenolpyruvate (PEP). In the final step, step 10, phosphoenolpyruvate donates its phosphate group to ADP, generating another molecule of ATP and producing pyruvate. This reaction is catalyzed by pyruvate kinase. Throughout the diagram, ATP, ADP, NAD⁺, NADH + H⁺, and Pi are labeled in red text, and curved arrows indicate the direction of enzymatic reactions. The caption notes that this half of glycolysis does not require additional ATP investment and results in the net gain of two NADH and four ATP molecules per glucose molecule. [Return to Figure 10.2.3]
Licenses and Attributions
“10.2 Glycolysis” is adapted from “7.2 Glycolysis” by Mary Ann Clark, Matthew Douglas, and Jung Choi for OpenStax Biology 2e under CC-BY 4.0. “10.2 Glycolysis” is licensed under CC-BY-NC 4.0.
Media Attributions
- fafd32072487bf1d3e8a0d71ae8179da0561625f
- 0ee2fa4f802104e76f9d7f9e79f1442ae3a60b64
- b9148483a53d5719d54a4c19e2fbdfab3f36d10a
first step in the breakdown of glucose to extract energy for cellular metabolism
transport takes place against the glucose concentration gradient
glucose transporter proteins; transporters contribute to facilitated diffusion of glucose into the cells
three-carbon sugar that serves as the end product of glycolysis
reduced form of NAD
enzyme that catalyzes the conversion of a molecule into one of its isomers
the metabolic pathway that uses the chemical energy (ATP and NADPH) generated during the light-dependent reactions of photosynthesis to fix atmospheric carbon dioxide (CO2) into G3P
oxidized form of NAD
adenosine diphosphate
