11.2 Impact of Temperature on Cell Function
Malia Hoey and Christelle Sabatier
Learning Objectives
By the end of this section, you will be able to do the following:
- Describe how temperature affects the rate and stability of enzyme-catalyzed reactions.
- Explain how temperature influences membrane fluidity in phospholipid bilayers.
- Identify how temperature changes impact protein structure and function in cells.
Body temperature has a direct and profound effect on cellular metabolism, influencing the structure and function of membranes, enzymes, and other proteins essential for life. Since nearly all biochemical reactions within an animal are enzyme-catalyzed, even small changes in temperature can have wide-ranging and significant effects on an animal’s overall physiology.
Temperature and Enzymatic Reactions
Enzymes are highly sensitive to temperature. Generally, as body temperature rises, enzyme activity increases significantly. For every 10℃ (ten degrees Celsius) rise in temperature, enzyme activity roughly doubles. This increase in activity continues up to an optimal temperature range. Beyond this optimum, high heat causes body proteins, including enzymes, to denature; their intricate three-dimensional structure unravels, leading to a complete loss of function. For most mammalian enzymes, this denaturation typically happens around 50℃.
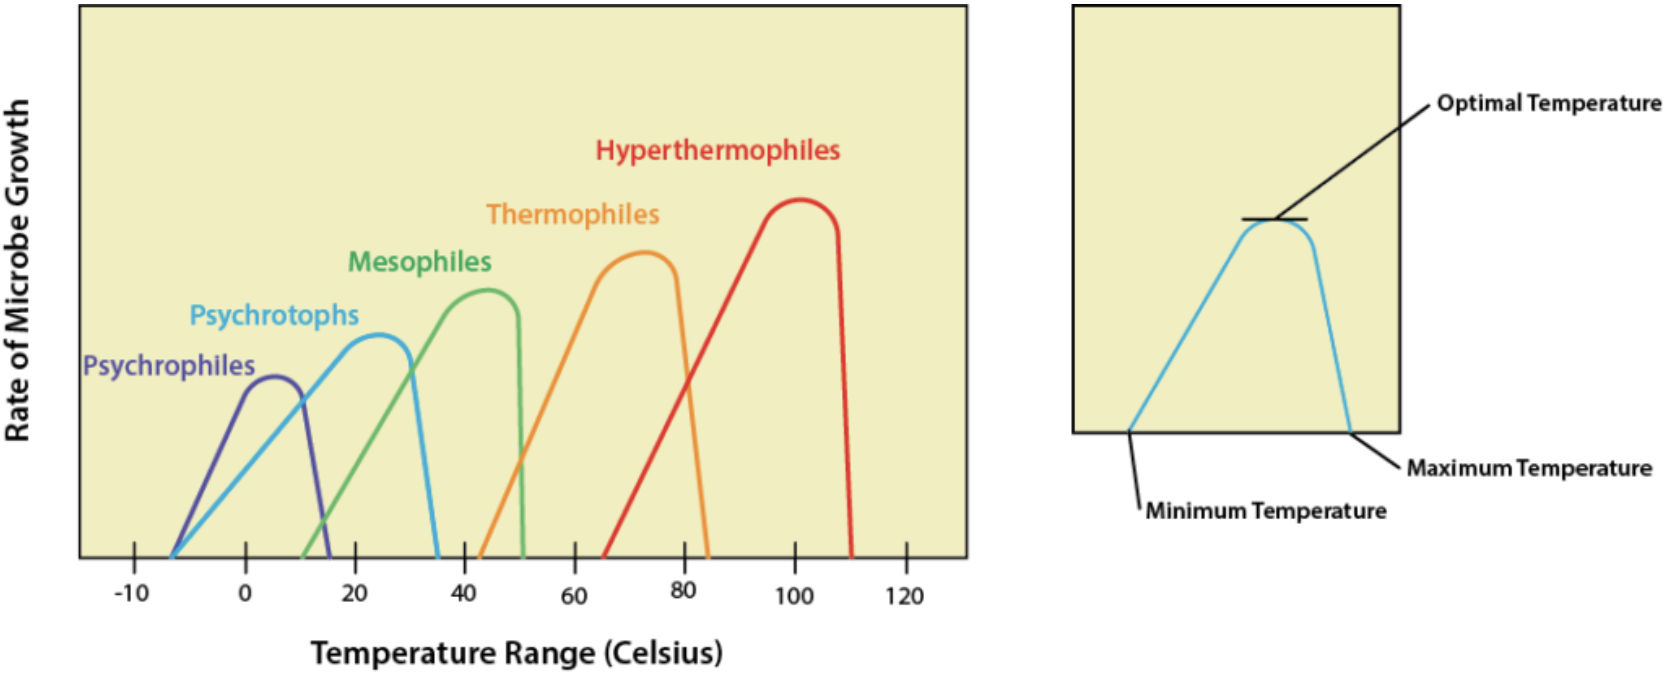
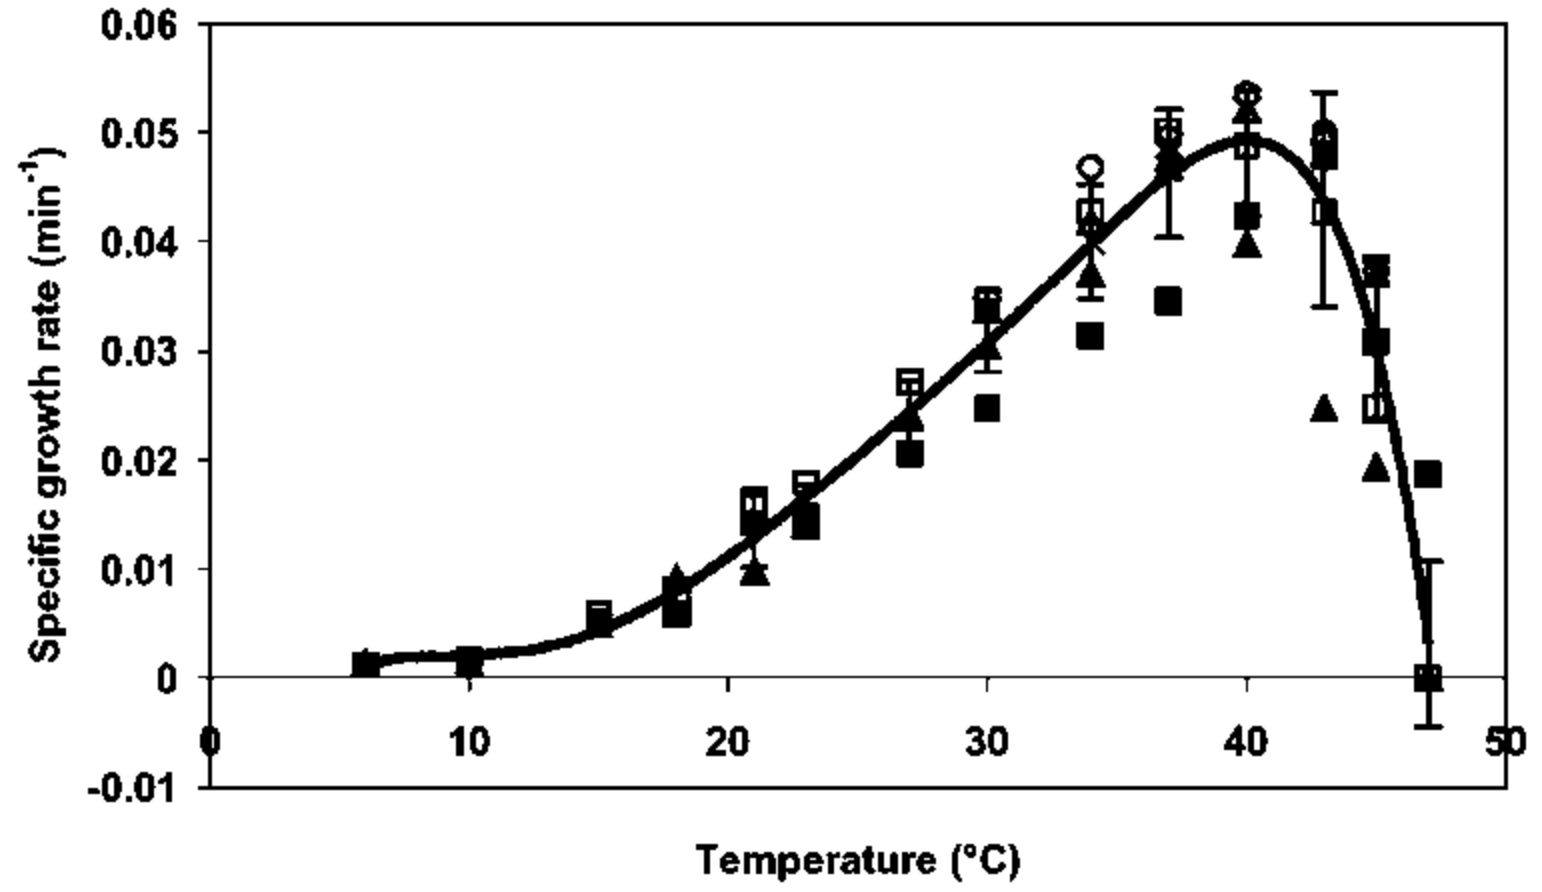
Conversely, as temperature drops, enzyme activity decreases. For every 10℃ drop in temperature, enzyme activity will decrease by half, eventually becoming negligible at or near freezing points. However, there are a few exceptions that exist. Some cold-adapted species, such as Arctic fish, produce specialized proteins (like antifreeze proteins) that allow enzymatic activity and even survival at subzero temperatures, or they may possess mechanisms to survive temporary freezing. These principles of temperature-dependent enzyme activity and denaturation also apply to microorganisms, where different bacterial species exhibit distinct optimal temperatures for growth, as illustrated in Figure 11.2.1.
Temperature and Phospholipid Membranes
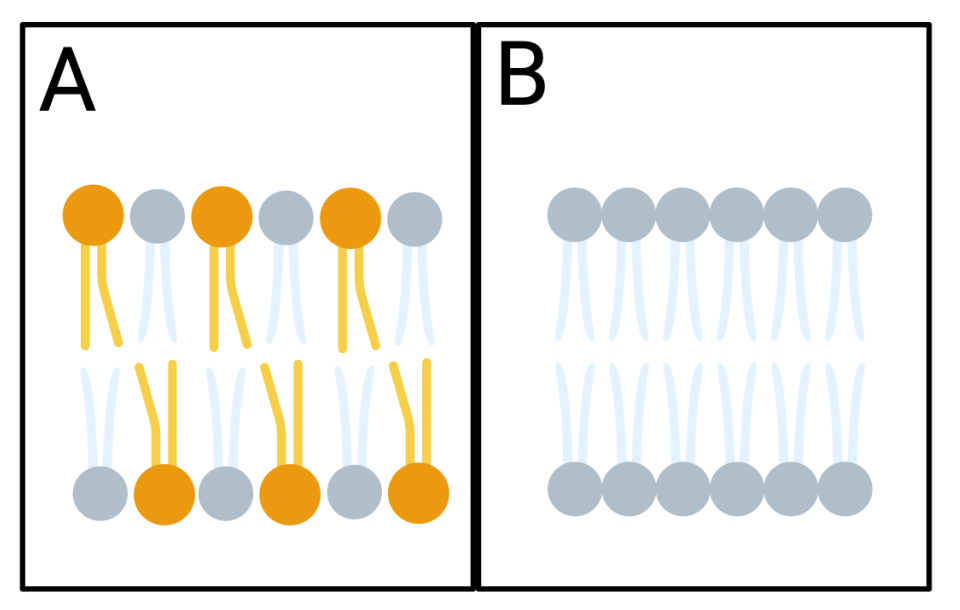
The fluidity of cell membranes is also highly temperature-dependent. Membranes are composed mainly of phospholipids, which arrange themselves in a dynamic structure often described as a fluid mosaic. At high temperatures, membranes can become excessively fluid, compromising their integrity and making cells overly permeable or even leaky. Conversely, at low temperatures, membranes become more rigid, which can interfere with essential cellular functions such as nutrient transport, signal reception, and the proper binding of membrane-bound enzymes.
Organisms exhibit remarkable adaptations by adjusting the composition of their membranes to maintain appropriate fluidity across different temperatures. For example, cold-adapted animals often incorporate more unsaturated fatty acids into their phospholipids, which prevent the membrane from becoming too rigid and help it remain fluid at lower temperatures. Additionally, cholesterol acts as a buffer, preventing low temperatures from reducing membrane fluidity and high temperatures from making the membrane too fluid.
Temperature and Proteins
Beyond enzymes (which are specialized proteins), many other structural and functional proteins throughout the body are also highly temperature-sensitive. High temperatures can lead to pervasive protein unfolding, a process known as denaturation, which impairs critical processes like muscle contraction, hormone function, and cellular repair. Conversely, low temperatures slow down the rates of protein synthesis and proper protein folding, which can significantly impact essential cellular activities such as cell division and tissue maintenance.
Practice Questions
Glossary
metabolism
chemical processes that occur within a living organism in order to maintain life
membrane fluidity
property of the cell membrane that allows movement of lipids and membrane proteins within the plane of the membrane and optimizes diffusion through the membrane.
Figure Descriptions
Figure 11.2.1. The image features two graphs displayed side by side on a beige background. The main graph on the left shows the rate of microbe growth as a function of temperature, with five overlapping curves labeled according to different types of microbes. The x-axis represents the temperature range in Celsius, spanning from -10 to 120 degrees, while the y-axis indicates the rate of microbe growth without numerical values. The curves are color-coded: Psychrophiles in purple, Psychrotrophs in blue, Mesophiles in green, Thermophiles in orange, and Hyperthermophiles in red. Each curve peaks at a different temperature, illustrating the optimal growth temperatures for each group. The inset graph on the right is a simplified version of a microbial growth curve, with three labeled points: minimum temperature, optimal temperature, and maximum temperature, connected by a single blue curve. [Return to Figure 11.2.1]
Figure 11.2.2. The image shows two diagrams, labeled A and B, inside separate boxes. Both diagrams display two rows of phospholipids representing a phospholipid bilayer. Diagram A on the left has the phospholipid bilayer made up of two different types of phospholipids, orange ones with unsaturated fatty acid tails and gray ones with saturated fatty acid tails.Diagram B on the right features only gray phospholipids with saturated fatty acid tails. [Return to Figure 11.2.2]
Figure 11.2.3. The image is a graph illustrating the specific growth rate of an organism in relation to temperature, measured in degrees Celsius. The x-axis represents temperature, ranging from 0 to 50°C, while the y-axis shows the specific growth rate in units per minute. The curve forms a bell shape, starting near zero growth rate at low temperatures, peaking around 40°C, and then declining sharply. Several data points are scattered along the curve, varying in shapes including squares, circles, and triangles, each representing different experimental data or conditions. Error bars accompany many of these points, indicating variability or uncertainty in the measurements. [Return to Figure 11.2.3]
Media Attributions
- 1A.B-Rate-of-Microbe-Growth © Open Library is licensed under a CC BY-NC (Attribution NonCommercial) license
- Plasma membrane and temperature © BioRender adapted by Christelle Sabatier is licensed under a CC BY-NC (Attribution NonCommercial) license
- 1A.B-Growth-rate-of-E. sakazakii is licensed under a CC BY-NC (Attribution NonCommercial) license
Chemical processes that occur within a living organism in order to maintain life.
property of the cell membrane that allows movement of lipids and membrane proteins within the plane of the membrane and optimizes diffusion through the membrane.
Extremophilic organisms that can grow and reproduce in low temperatures(-20C to 20C)
Cold-tolerant organisms that can grow and reproduce in low temperatures(15C to 20C)
A bacteria or an organism that grows and reproduces the best in moderate temperatures(20C to 45C)
A bacteria or organism that grows and reproduces better in high temperatures(41 and 122C).
A bacteria or organism that thrives in extremely hot temperatures(60C).
