15.4 Predicting Phenotypes and Genotypes
Elizabeth Dahlhoff
Learning Objectives
By the end of this section, you will be able to do the following:
- Explain the relationship between genotypes and phenotypes in dominant and recessive gene systems.
- Develop a Punnett square to calculate the expected proportions of genotypes and phenotypes in a monohybrid cross.
- Draw and interpret pedigrees to trace the inheritance of traits across generations, using standard pedigree symbols and relationships.
The seven characteristics that Mendel evaluated in his pea plants were each expressed as one of two versions, or traits. The physical expression of characteristics is accomplished through the expression of genes carried on chromosomes. The genetic makeup of peas consists of two similar or homologous copies of each chromosome, one from each parent. Each pair of homologous chromosomes has the same linear order of genes. In other words, peas are diploid organisms in that they have two copies of each chromosome. The same is true for many other plants and for virtually all animals. Diploid organisms utilize meiosis to produce haploid gametes, which contain one copy of each homologous chromosome that unite at fertilization to create a diploid zygote.
For cases in which a single gene controls a single characteristic, a diploid organism has two genetic copies that may or may not encode the same version of that characteristic. For example, one individual pea plant (such as those studied by Mendel) would have two copies of the gene that controls flower color. That individual could carry one version of the gene that leads to white flower color and a second different version of that same gene that leads to violet flower color. The interaction between these two different versions of the same gene will lead to the visible flower color in the pea plant. Gene variants that arise by mutation and exist at the same relative locations on homologous chromosomes are called alleles. Mendel examined the inheritance of genes with just two allele forms, but it is common to encounter more than two alleles for any given gene in a natural population.
Phenotypes and Genotypes
Two alleles for a given gene in a diploid organism are expressed and interact to produce physical characteristics. The observable traits expressed by an organism are referred to as its phenotype. An organism’s underlying genetic makeup, consisting of both physically visible and non-expressed alleles, is called its genotype. Mendel’s hybridization experiments demonstrate the difference between phenotype and genotype. When true-breeding plants in which one parent had yellow pods and one had green pods were cross-fertilized, all of the F1 hybrid offspring had yellow pods. That is, the hybrid offspring were phenotypically identical to the true-breeding parent with yellow pods. However, we know that the allele donated by the parent with green pods was not simply lost because it reappeared in some of the F2 offspring. Therefore, the F1 plants must have been genotypically different from the parent with yellow pods.
The P1 plants that Mendel used in his experiments were each homozygous for the trait he was studying. Diploid organisms that are homozygous at a given gene, or locus, have two identical alleles for that gene on their homologous chromosomes. Mendel’s parental pea plants always bred true because both of the gametes produced carried the same trait. When P1 plants with contrasting traits were cross-fertilized, all of the offspring were heterozygous for the contrasting trait, meaning that their genotype reflected that they had different alleles for the gene being examined.
Dominant and Recessive Alleles
Our discussion of homozygous and heterozygous organisms brings us to why the F1 heterozygous offspring were identical to one of the parents, rather than expressing both alleles. In all seven pea-plant characteristics, one of the two contrasting alleles was dominant, and the other was recessive. Mendel called the dominant allele the expressed unit factor; the recessive allele was referred to as the latent unit factor. We now know that these so-called unit factors are actually genes on homologous chromosome pairs. For a gene that is expressed in a dominant and recessive pattern, homozygous dominant and heterozygous organisms will look identical (that is, they will have different genotypes but the same phenotype). The recessive allele will only be observed in homozygous recessive individuals. Several conventions exist for referring to genes and alleles. For the purposes of this chapter, we will abbreviate genes using the first letter of the gene’s corresponding dominant trait. For example, violet is the dominant trait for a pea plant’s flower color, so the flower-color gene would be abbreviated as V (note that it is customary to italicize gene designations). Furthermore, we will use uppercase and lowercase letters to represent dominant and recessive alleles, respectively. Therefore, we would refer to the genotype of a homozygous dominant pea plant with violet flowers as VV, a homozygous recessive pea plant with white flowers as vv, and a heterozygous pea plant with violet flowers as Vv.
Pedigrees
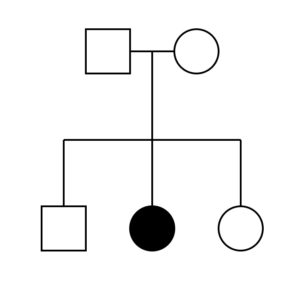
Inheritance of a trait through generations can be shown visually using a pedigree, such as is pictured in Figure 15.4.1. Square shapes represent males; circles represent females. Filled-in shapes are individuals that have whatever trait is being shown in the pedigree. Two individuals connected together with a horizontal line between them are the parents of the individuals that are connected by vertical lines below them. Siblings are typically shown in birth order with the oldest sibling to the left.
Punnett Squares
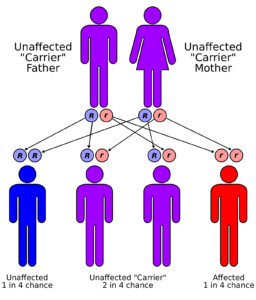
As discussed above, diploid individuals have two copies of each chromosome: one from their male parent, one from their female parent. This means they have two copies of each gene. They can have two of the same alleles (homozygous) or two different alleles (heterozygous). Regardless of their genotype, they will randomly pass only one copy of each chromosome to their offspring. This is because meiosis produces haploid gametes that contain one copy of each chromosome, and those chromosomes are assorted into gametes randomly. Since genes are present on chromosomes, this means they will pass one copy of each gene to their offspring. That means that an offspring inherits one allele of each gene from each of its two parents. This is illustrated in Figure 15.4.2 This concept is called Mendel’s Law of Segregation.
An easy, organized way of illustrating the offspring that can result from two specific parents is to use a Punnett square. The gametes that can be generated by each parent are represented above the rows and next to the columns of the square. Each gamete is haploid for the “A gene,” meaning it only contains one copy of that gene. In the Punnett square seen in Figure 15.4.3, haploid eggs are above each column and haploid sperm are next to each row. When a haploid sperm and a haploid egg (each with one copy of the “A gene”) combine during the process of fertilization, a diploid offspring (with two copies of the A gene) is the result.
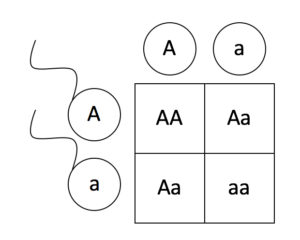
A Punnett square shows the probability of an offspring with a given genotype resulting from a cross. It does not show actual offspring. For example, the Punnett square in Figure 15.4.3 shows that there is a 25% chance that a homozygous recessive offspring will result from the cross Aa x Aa. It does not mean that these parents must have 4 offspring and that they will have the ratio 1 AA:2 Aa:1 aa. It’s just like flipping a coin: You expect 50% heads, but you wouldn’t be too surprised to see 7 heads out of 10 coin flips. Additionally, the probability does not change for successive offspring. The probability that the first offspring will have the genotype “aa” is 25% and the probability of the second offspring having the genotype “aa” is still 25%. Again, it’s just like flipping a coin: if you flip heads the first time, that doesn’t change the probability of getting heads on the next flip.
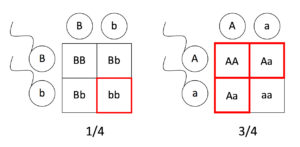
Organisms don’t just inherit one trait at a time, though. They inherit all their traits at once. Sometimes, we want to determine the probability of an individual inheriting two different traits. The easiest way to do this is to determine the probability of the individual inheriting each trait separately, then multiply those probabilities together. An example of this can be seen in Figure 15.4.4. In order for this to work, we must assume that genes do not influence each other with regard to the sorting of alleles into gametes, and every possible combination of alleles for every gene is equally likely to occur. This is called Mendel’s Law of Independent Assortment.
Another way of determining the probability of getting two different traits is to use a dihybrid Punnett square. Figure 15.4.5 shows three generations of the inheritance of pea seed color and shape. Peas can be either yellow or green, and they can be either round or wrinkled. These are two of the traits that Mendel studied in his work with peas. In the first generation (the “P” generation), two true-breeding (homozygous) individuals are crossed. Their offspring will get one allele of the Y gene and one allele of the R gene from each parent. This means that all their offspring (the “F1” generation) will be heterozygous for both genes. The results (the “F2” generation) from crossing two heterozygous individuals can be seen in the 4×4 Punnett square in Figure 15.4.5.
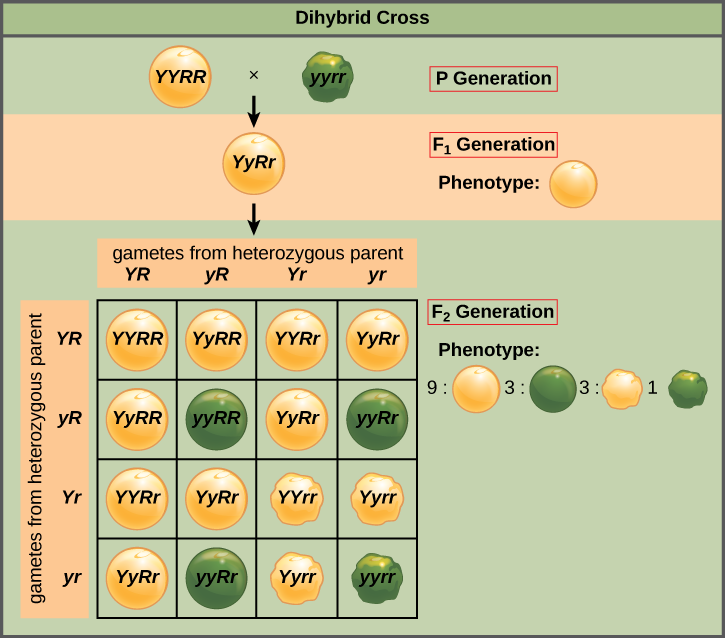
The gametes produced by the F1 individuals must have one allele from each of the two genes. For example, a gamete could get an R allele for the seed shape gene and either a Y or a y allele for the seed color gene. It cannot get both an R and an r allele; each gamete can have only one allele per gene. The Law of Independent Assortment states that a gamete into which an r allele is sorted would be equally likely to contain either a Y or a y allele. Thus, there are four equally likely gametes that can be formed when the RrYy heterozygote is self-crossed, as follows: RY, rY, Ry, and ry. Arranging these gametes along the top and left of a 4 × 4 Punnett square (Figure 15.4.5) gives us 16 equally likely genotypic combinations. From these genotypes, we find a phenotypic ratio of 9 round–yellow:3 round–green:3 wrinkled–yellow:1 wrinkled–green (Figure 15.4.5). These are the offspring ratios we would expect, assuming we performed the crosses with a large enough sample size.We can look for individuals who have the recessive phenotype for Y and the dominant phenotype for R. These individuals must have two little y’s and at least one big R. The possible genotypes are yyRR or yyRr. Examining the Punnett square in Figure 15.11, we can find three individuals with these genotypes (they are round and green). If you compare the results from Figure 15.4.4 and Figure 15.4.5, you’ll see that we have arrived at the same value: 3/16!
Practice Questions
Section Summary
An organism’s genotype refers to its genetic makeup (the alleles it carries), while its phenotype is the observable expression of those alleles. When an individual carries two identical alleles for a gene, they are homozygous; if the alleles differ, they are heterozygous. Mendel found that in many cases, one allele is dominant, meaning its traits are expressed in the phenotype even if only one copy is present, while the other allele is recessive and only expressed when both alleles are recessive. Punnett squares are tools that can be used to predict the probability of offspring genotypes and phenotypes resulting from specific parental crosses, illustrating how alleles segregate and combine. When analyzing inheritance of two genes simultaneously, dihybrid crosses are used, and their outcomes follow Mendel’s Law of Independent Assortment, which states that alleles of different genes assort independently during gamete formation—assuming the genes are not linked on the same chromosome. Genetic inheritance across generations can be visualized using pedigree charts, which are useful for systems where experiments are not possible. These diagrams use standardized symbols to represent individuals, relationships, and the presence or absence of traits, aiding in the analysis of inheritance patterns; they are particularly important in human genetics.
Glossary
- dihybrid cross
- a cross between individuals heterozygous for two traits (e.g., RrYy x RrYy), showing how two genes are inherited together
- gamete
- a reproductive cell (sperm or egg) that contains one set of chromosomes (haploid)
- Law of Independent Assortment
- Mendel’s principle stating that genes for different traits are sorted independently during gamete formation
- Law of Segregation
- Mendel’s principle stating that allele pairs separate during gamete formation, so each gamete gets one allele
- pedigree
- a diagram that shows how a trait is inherited through several generations
- Punnett square
- a chart used to predict genetic outcomes and probabilities of offspring traits
- zygote
- a fertilized egg cell formed by the union of two gametes; it is diploid
Figure Descriptions
Figure 15.4.1. A simple pedigree diagram shows two parents at the top: a square for an unaffected male and a circle for an unaffected female connected by a horizontal mating line. A vertical line descends from the mating line to a horizontal sibling line connecting three offspring. From left to right, the children are represented by an unaffected male (square, unshaded), an affected female (circle, filled black), and an unaffected female (circle, unshaded). The filled circle indicates that this female has the condition depicted in the pedigree. [Return to Figure 15.4.1]
Figure 15.4.2. The diagram depicts autosomal recessive inheritance. At the top, two purple human figures (one male, one female) represent heterozygous parents, each labeled with genotype Rr. Below them are four children: from left to right, a blue male labeled RR (homozygous dominant, unaffected), a purple male labeled Rr (heterozygous carrier), a purple male labeled Rr (heterozygous carrier), and a red male labeled rr (homozygous recessive, affected). The color coding indicates phenotype: blue for unaffected, purple for carrier, and red for affected. [Return to Figure 15.4.2]
Figure 15.4.3. The diagram shows a Punnett square for a cross between two heterozygous parents (Aa × Aa). The parent gametes are labeled “A” and “a” across the top and side. The four boxes inside the grid show the possible offspring genotypes: top left is AA, top right is Aa, bottom left is Aa, and bottom right is aa. [Return to Figure 15.4.3]
Figure 15.4.4. The image contains two Punnett squares side by side. The left square shows the cross Bb × Bb with possible genotypes BB, Bb, Bb, and bb; the bb square is outlined in red to indicate the 1/4 probability of the recessive “B” phenotype. The right square shows the cross Aa × Aa with genotypes AA, Aa, Aa, and aa; the three boxes for AA and Aa are outlined in red to indicate the 3/4 probability of the dominant “A” phenotype. Text under the left square reads “1/4” and text under the right square reads “3/4.” The caption explains that multiplying these probabilities gives a 3/16 chance of an offspring having the recessive “B” phenotype and dominant “A” phenotype. [Return to Figure 15.4.4]
Figure 15.4.5. The diagram is titled “Dihybrid Cross” and depicts the results of crossing pea plants for two traits: seed color (Y = yellow, y = green) and seed shape (R = round, r = wrinkled). The P generation shows one parent with genotype YYRR (yellow round seeds) crossed with another having yyrr (green wrinkled seeds). The resulting F1 generation plant is YyRr (yellow round seeds). Below, a 4×4 Punnett square shows the F2 generation from crossing two YyRr plants. The top and left edges list the four gamete combinations from each heterozygous parent: YR, yR, Yr, and yr. Each square contains the resulting genotype and an illustration of the seed phenotype. The phenotypic ratio shown is 9 yellow round:3 green round:3 yellow wrinkled:1 green wrinkled. [Return to Figure 15.4.5]
Licenses and Attributions
This chapter, “Predicting Phenotypes and Genotypes,” by Elizabeth Dahlhoff, is adapted from “Pedigrees and Punnett Squares” in Principles of Biology by Lisa Bartree, Walter Shriner and Catherine Creech (Mt. Hood Community College) under a CC BY-NC 4.0 license. This work is licensed under a CC BY-NC 4.0 license.
Media Attributions
- dihybrid peas
