19.4 Protein Function
Michelle McCully
Learning Objectives
By the end of this chapter, you will be able to do the following:
- Assess favorable interactions between a wild type amino acid and a ligand.
- Predict favorable and unfavorable interactions between a mutant amino acid and a ligand.
- Predict the functional effect of a mutation in a protein.
Genes can develop mutations due to the presence of mutagens or in the normal course of DNA replication. Some mutations in a gene’s DNA sequence can lead to substitution mutations in the amino acid sequence of the expressed protein. In this case, we would say that the wild type amino acid is changed to a different, mutant amino acid.
Substitution mutations can have a small, large, or no effect on the function of a protein. It’s impossible to predict the functional outcomes of mutations with certainty, based only on the protein’s structure, but we can make educated predictions.
Preliminary Considerations
When predicting the functional outcome of a substitution mutation, the first thing to consider is proximity of the mutation to the functional region of the protein. The functional region refers to the amino acid residues in the protein that interact with whatever molecules are necessary for the protein to do its job. If the mutation is far away from the functional region, we would expect there to be less impact on the function of the protein than if it is in the functional region. That said, some mutations can cause overall instability of the protein, which would affect the function. However, we will not be focusing on those here.
The second thing to consider is the class of amino acid of the wild type and mutant. If both are the same class, we would predict there to be a smaller impact on function than if the classes were different. However, to make a more educated guess, we must look at the structure of the protein to assess the favorable and unfavorable interactions in the wild type and mutant amino acids.
Assessment of Favorable Interactions in the Wild Type
The third consideration is how important the wild type residue is to the function of the protein. If the wild type residue makes favorable interactions with a molecule that the protein must interact with to do its job, then changing the residue will have a larger negative impact on function.
Three favorable interactions that a residue may make are hydrogen bonds and salt bridges, together considered polar interactions, and hydrophobic interactions.
Perhaps the most important noncovalent interaction in biological molecules is the hydrogen bond, an attractive interaction between a hydrogen atom bonded to an electronegative O or N atom and an unshared electron pair on another O or N atom. In essence, a hydrogen bond is a very strong dipole–dipole interaction involving polarized O–H or N–H bonds. Electrostatic potential maps of water and ammonia clearly show the positively polarized hydrogens (blue) and the negatively polarized oxygens and nitrogens (red) (Figure 19.4.1). The electronegative atom that is covalently bound to the hydrogen atom is defined as the hydrogen bond donor, and the electronegative atom from the other residue or molecule is defined as the hydrogen bond acceptor.
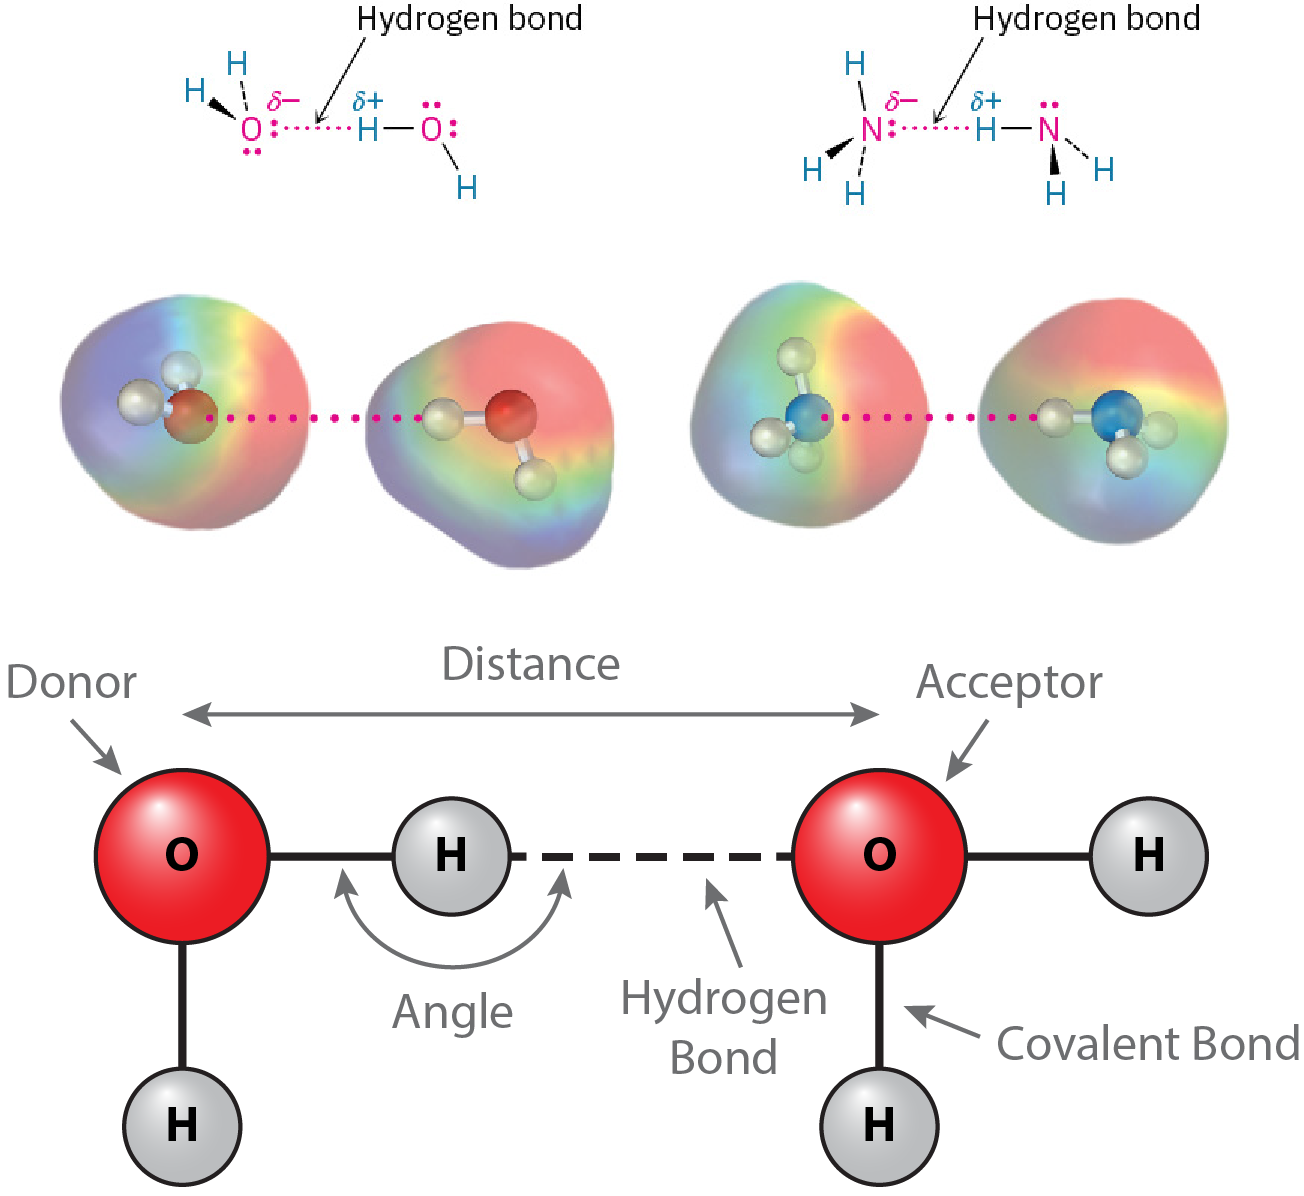
In proteins, hydrogen bonds may form between the O-H and N-H groups of polar or charged amino acids (Figure 19.4.2). The presence of hydrogen bonds may be predicted by the geometry of the atoms involved. The distance between the hydrogen bond donor and acceptor should be around 3 to 4 Å. The angle formed between the donor-hydrogen covalent bond and the hydrogen-acceptor hydrogen bond should be between 150° and 210°, which is another way of saying within 30° of linearity.
For Figures 19.4.2, 19.4.3, and 19.4.5, you can click and drag to view the functional regions in 3D. Zoom by scrolling or pinching. You can click or tap on the arrows in the top right corner to make the model full screen.
Figure 19.4.2. Hydrogen bonds. A portion of the protein, streptavidin, is shown in gray with its ligand, biotin, in cyan. Hydrogen bonds are drawn as yellow-dotted lines, including one between the carbonyl group of biotin and Asn23. [Image Description]
The opposite charges of cations and anions exert a moderately strong mutual attraction that keeps the atoms in close proximity forming an ionic bond, or salt bridge. A salt bridge is an ongoing, close association between ions of opposite charge (Figure 19.4.3). The table salt you sprinkle on your food owes its existence to ionic bonding. The cation Na+ is strongly attracted to the chloride anion, Cl–.
In proteins, the charged amino acids may form salt bridges with each other, ions, or other charged molecules. Salt bridges occur between an anion and cation that are about 2 to 3 Å apart, and there is no optimal angle like for hydrogen bonds.
Figure 19.4.3. Salt bridges. A portion of the E. coli protein, polyphosphate kinase, is shown in gray with its ligand, ATP, in rose. Salt bridges are drawn as yellow-dotted lines, including one between the phosphate group of ATP and an Arg564. Two Mg2+ cations are shown as yellow spheres. [Image Description]
Dispersion forces occur between all neighboring molecules and arise because the electron distribution within molecules is constantly changing. Although uniform on a time-averaged basis, the electron distribution even in nonpolar molecules is likely to be nonuniform at any given instant. One side of a molecule may, by chance, have a slight excess of electrons relative to the opposite side, giving the molecule a temporary dipole. This temporary dipole in one molecule causes a nearby molecule to adopt a temporarily opposite dipole, resulting in a tiny attraction between the two (Figure 19.4.4). Temporary molecular dipoles have only a fleeting existence and are constantly changing, but their cumulative effect is often strong enough to hold molecules or amino acids close together.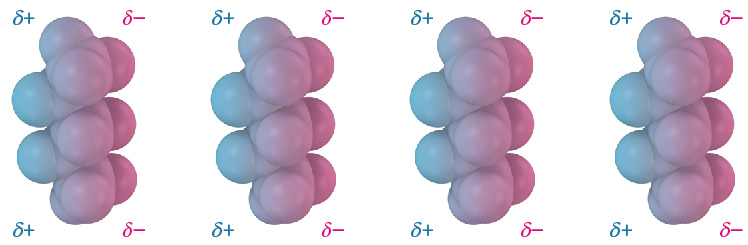
Figure 19.4.4. Dispersion forces. Attractive dispersion forces in nonpolar molecules are caused by temporary dipoles, as shown in these models of pentane, C5H12. [Image Description]
In proteins, we see dispersion forces manifested as hydrophobic interactions, where hydrophobic amino acids pack tightly together with the exclusion of water (Figure 19.4.5). These hydrophobic interactions are strongest when interacting atoms are spaced just beyond the sum of their van der Waals radii. Within hydrophobic amino acids, we would expect the aliphatic and aromatic carbon atoms to form hydrophobic interactions.
Figure 19.4.5. Hydrophobic interactions. A portion of the human dopamine transporter is shown in gray with its ligand, dopamine, in green. Hydrophobic residues and dopamine are shown in spheres. Favorable hydrophobic interactions occur when the edges of the spheres of aliphatic or aromatic carbon atoms are almost touching, including between the benzene ring in dopamine and Phe326. [Image Description]
Connecting Concepts
For more on:
- Ions and covalent bonds, see Atoms, Ions, and Molecules
- Electronegativity, hydrogen bonds, and van der Waals interactions, see Covalent Bonds and Other Molecular Interactions
- Aliphatic and aromatic carbons, see Carbon
Assessment of Unfavorable Interactions in the Mutant
The fourth consideration is how damaging the mutant residue is to the function of the protein. If the mutant residue makes unfavorable interactions with a molecule that the protein must interact with to do its job, then it will have a large negative impact on function.
Just as cations and anions can interact favorably with each other to form a salt bridge, ions of the same charge repel each other in an effect called charge-charge repulsion. Inserting, a negatively charged amino acid in a functional region where a negatively charged molecule binds, for example, would be very unfavorable. In this case, the molecule would be repelled and no longer bind, so we would expect function to be lost.
Hydrogen bonds, salt bridges, and hydrophobic interactions all occur when atoms are at an ideal distance from each other. If atoms get too close together, shorter than the sum of their van der Waals radii, there are strong repulsive forces called a steric clash. If the mutant amino acid is bigger than the wild type, it may form steric clashes with the other amino acids around it or the other molecules that need to bind in the functional region. In our predicted structures, we will see this as molecules overlapping, but in vivo, molecules cannot actually overlap. Instead, the protein will rearrange its structure to accommodate the larger amino acid and/or the molecule will not be able to get into the functional region to bind.
Making a Prediction
When we use a protein’s structure to make a prediction about whether the mutation will have a large, small, or no effect on function, we must consider the following:
- The proximity of the mutation to the functional region
- The class of amino acid of the wild type and mutant
- The favorable interactions in the wild type that are lost
- The unfavorable interactions in the mutant that are gained
If the mutation is outside the functional region, we will predict that there will be no effect on function.
If the wild type and mutant residues are both within the same class of amino acids, we would generally predict a less disruptive mutation than if they were in different classes. However, if a structure is available, it is preferable to assess the atomic interactions.
If the wild type residue makes a favorable interaction with other residues or a molecule that binds in the functional region, we would predict a medium-to-large loss of function. The more favorable the interaction, the larger loss of function we would predict. If this interaction is not maintained in the mutant, we would again predict a larger loss of function. Even if the favorable interaction is maintained in the mutant, we would probably predict at least a small loss of function. Functional regions are highly optimized evolutionarily, and any single amino acid change was probably selected against already.
If the mutant residue makes an unfavorable interaction with other residues or a molecule that binds in the functional region, we would predict a complete loss of function.
Practice Questions
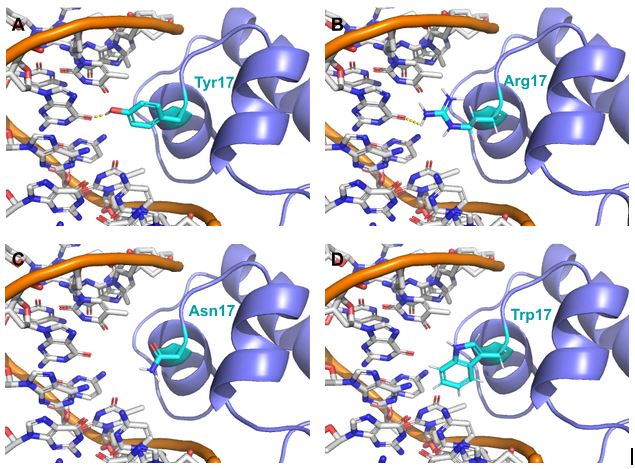
LacI repressor (purple cartoon) is modeled bound to DNA (orange backbone, white nucleotides) with its residue 17 in cyan sticks. Oxygen atoms are red, and nitrogen atoms are blue. Predicted hydrogen bonds are shown in dotted yellow lines. (A) Wild type Tyr 17 and possible mutants (B) Arg 17, (C) Asn 17, and (D) Trp 17.
Figure Descriptions
Figure 19.4.1. The image consists of diagrams illustrating the concept of hydrogen bonding. At the top, there are two small diagrams with molecular structures showing hydrogen bonds. The first diagram depicts two water molecules, where the hydrogen atom of one molecule is connected with a dotted pink line to the oxygen atom of another, depicting a hydrogen bond. The atoms are labeled with partial charges: oxygen labeled as δ- and hydrogen as δ+. The same labeling and connection style are shown in the second diagram but with two ammonia molecules, where the hydrogen atom of one ammonia molecule forms a hydrogen bond with the nitrogen atom of the other. Below these, there are colorful 3D molecular models corresponding to the structural diagrams. Each molecule is represented with a colored gradient: rainbow-like for electron clouds around the molecules, highlighting the areas of interaction. The hydrogen bonds are also denoted with dotted pink lines. At the bottom, there is a larger diagram showing a simplified representation of hydrogen bonding between two water molecules. The donor and acceptor oxygen atoms are in red, connected by a dashed line indicating the hydrogen bond. The diagram also labels the hydrogen bonds, covalent bonds, bond angles, and distances between molecules. [Return to Figure 19.4.1]
Figure 19.4.2. The image shows a 3D model of a protein structure, with a focus on a ligand interaction. The protein is represented using a ribbon diagram, depicted in shades of gray, indicating its secondary structural elements. The beta-sheets are represented by broad, flat arrows, while coils and loops are depicted as thinner, winding lines. The ligand, likely a small organic molecule, is depicted in bright cyan, showing a hexagonal ring structure with various extensions. Yellow dashed lines illustrate potential hydrogen bonds or interactions between the ligand and protein’s amino acid residues. The atoms within the structure are color-coded: nitrogen atoms in blue, oxygen in red, carbon primarily in gray, and the ligand’s carbon atoms in a distinct cyan. This color differentiation highlights areas of interaction and molecular geometry. [Return to Figure 19.4.2]
Figure 19.4.3. The image depicts a molecular structure rendered in 3D. It features a complex arrangement of twisted and coiled lines representing the backbone of a protein structure, depicted in grey. Intertwined within this arrangement are several molecules and atoms highlighted with different colors. Two prominent green spheres represent large atoms or ions placed centrally within the image, while smaller atomic structures in blue, red, and pink form a chain-like configuration, possibly symbolizing a chemical compound or ligand interacting with the protein. Yellow dashed lines indicate potential interactions or bonds between the different molecular components. [Return to Figure 19.4.3]
Figure 19.4.4. The image showcases a series of four identical models, each representing a molecule structure composed of spheres connected in a linear formation. The molecule models feature a gradient of blue and pink colors, with the blue hue indicating a partial positive charge (δ+) and the pink hue indicating a partial negative charge (δ−). Each model consists of five spheres aligning vertically. The blue spheres are positioned on the left side, and the pink spheres are on the right side. Above each group of blue spheres is the text δ+, and above each group of pink spheres is the text δ−. [Return to Figure 19.4.4]
Figure 19.4.5. The image depicts a three-dimensional molecular structure of a protein. The protein is represented by a series of intertwined, gray ribbon-like helices. Among these helices, a cluster of colored spheres representing different atoms is visible, with green, red, blue, and other colors indicating various elements. The helices wrap around the cluster, creating a complex structure that is compact and tightly bound. The background is white, allowing the structure to stand out clearly. [Return to Figure 19.4.5]
Figure 19.4.6. The figure contains four molecular models (A to D) showing the E. coli LacI repressor (purple ribbon structure) bound to DNA, depicted with an orange sugar-phosphate backbone and white nucleotide bases. In each panel, residue 17 of the LacI repressor is shown as a cyan stick model, with oxygen atoms in red and nitrogen atoms in blue, and dotted yellow lines indicating predicted hydrogen bonds between residue 17 and the DNA. Panel A shows the wild-type Tyr17 side chain positioned near the DNA, panel B depicts the Arg17 mutant forming multiple predicted hydrogen bonds with DNA, panel C shows the Asn17 mutant oriented toward DNA with predicted hydrogen bonding, and panel D presents the Trp17 mutant positioned near the DNA without visible hydrogen bonds. [Return to Figure 19.4.6]
Licenses and Attributions
“Protein Function” by Michelle McCully is adapted from “2.12 Noncovalent Interactions between Molecules” by John McMurry, Professor Emeritus for OpenStax Organic Chemistry 2e used under CC BY-NC-SA 4.0. “Protein Function” is licensed under CC BY-NC-SA 4.0.
Media Attributions
- 1C-J-3.3 Figure – hydrogen bonds chemistry © John McMurry, Professor Emeritus adapted by Michelle McCully is licensed under a CC BY-NC-SA (Attribution NonCommercial ShareAlike) license
- 1C-J-3.3 Figure – dispersion forces © John McMurry, Professor Emeritus is licensed under a CC BY-NC-SA (Attribution NonCommercial ShareAlike) license
- 1C-J-3.3 Quiz Image – mutations © Michelle McCully is licensed under a CC BY-NC (Attribution NonCommercial) license
