19.3 Protein structure and function
Michelle McCully
Learning Objectives
By the end of this chapter, you will be able to do the following:
- Predict the functional effects of mutations in β-galactosidase
Proteins are one of the most abundant biological macromolecules in living systems and have the most diverse range of functions of all macromolecules. Proteins may be structural, regulatory, contractile, or protective. They may serve in transport, storage, or membranes; or they may be toxins or enzymes. Each cell in a living system may contain thousands of proteins, each with a unique function. Their structures, like their functions, vary greatly, and by interrogating their structures, we can make predictions about their functions.
1. Protein structure
A protein’s shape is critical to its function. For example, an enzyme can bind to a specific substrate at an active site. If this active site is altered because of local changes or changes in overall protein structure, the enzyme may be unable to bind to the substrate. To understand a protein’s shape or conformation, we need to understand the four levels of protein structure: primary, secondary, tertiary, and quaternary.
Primary Structure
The amino acid sequence in a polypeptide chain is its primary structure. For example, the primary sequence of the β chain of human hemoglobin may be found on Uniprot, entry P68871. The N-terminal amino acid is valine (Val, V), and the C-terminal amino acid is histidine (His, H) (Figure 1). The amino acid sequence of hemoglobin is the same every time it is expressed, and hemoglobin is the only protein that has exactly this sequence of amino acids.
VHLTPEEKSAVTALWGKVNVDEVGGEALGRLLVVYPWTQRFFESFGDLSTPDAVMGNPKVKAHGKKVLGAFSDGLAHLDNLKGTFATLSELHCDKLHVDPENFRLLGNVLVCVLAHHFGKEFTPPVQAAYQKVVAGVANALAHKYH
Figure 1: Primary structure of human hemoglobin β chain. The β chain of human hemoglobin has 146 amino acids, all linked together in sequence with peptide bonds.
The gene encoding the protein ultimately determines the unique sequence of amino acids for every protein. A change in nucleotide sequence in the gene’s coding region may lead to change in the amino acid sequence, causing a change in the protein’s structure and sometimes, therefore its function. In people who have sickle cell anemia, the hemoglobin β chain (a small portion of which is shown in Figure 2) has a single amino acid substitution, causing a change in the protein’s structure and function. Specifically, at the sixth position in the primary sequence of the β chain, the wild type amino acid, glutamate (Glu, E) is substituted by valine (Val, V). What is most remarkable to consider is that a hemoglobin molecule is comprised of two α and two β chains that each consist of about 150 amino acids. The full hemoglobin protein, therefore, has about 600 amino acids. The structural difference between a normal hemoglobin molecule and a sickle cell molecule – which dramatically decreases life expectancy – is two amino acids of the ~600.
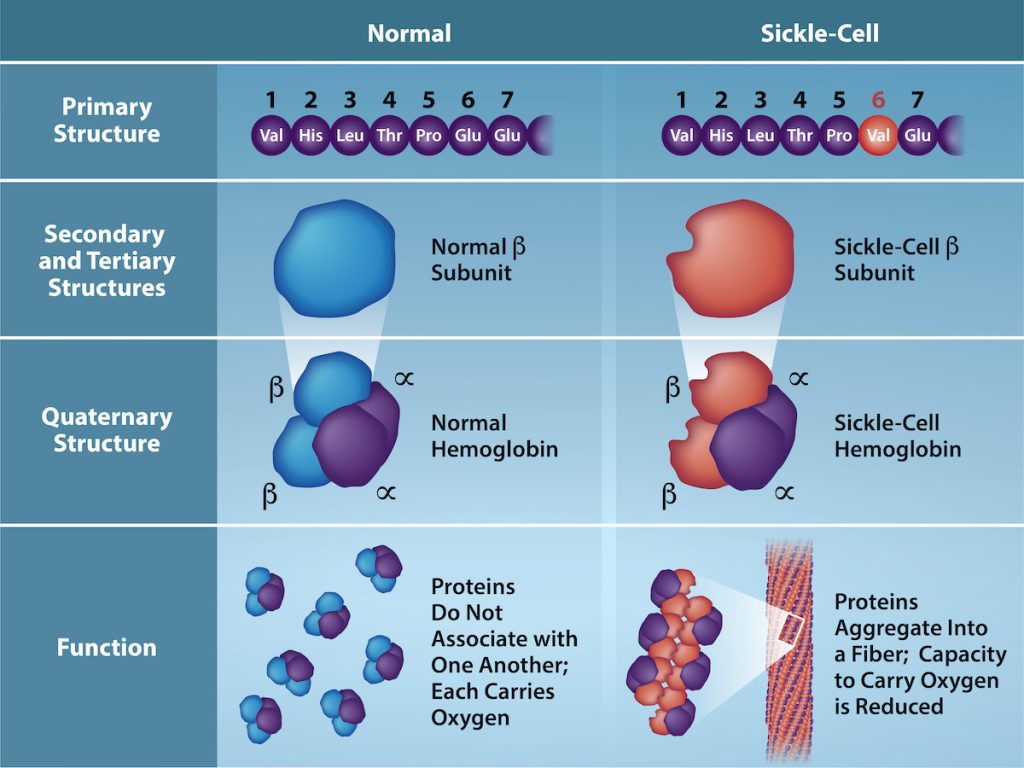
Figure 2: Structure and function of hemoglobin. Because of one change in the primary, amino acid sequence of the β chain of hemoglobin, hemoglobin proteins form long fibers that distort normally disc-shaped, red blood cells and causes them to assume a crescent or “sickle” shape, which clogs blood vessels. In wild type hemoglobin, the amino acid at position six is glutamate, but in sickle cell hemoglobin, it is valine. (Credit: Rao, A., Tag, A. Ryan, K. and Fletcher, S. Department of Biology, Texas A&M University) [Image Description]
Secondary Structure
The local folding of the polypeptide in some regions gives rise to the secondary structure of the protein. The most common are the α-helix and β-pleated sheet structures (Figure 3). Both structures are held in shape by backbone hydrogen bonds. In α-helices, for example, hydrogen bonds form between the oxygen atom in the carbonyl group in one amino acid and hydrogen and nitrogen atoms in the amide group of another amino acid that is four amino acids away in the primary sequence.
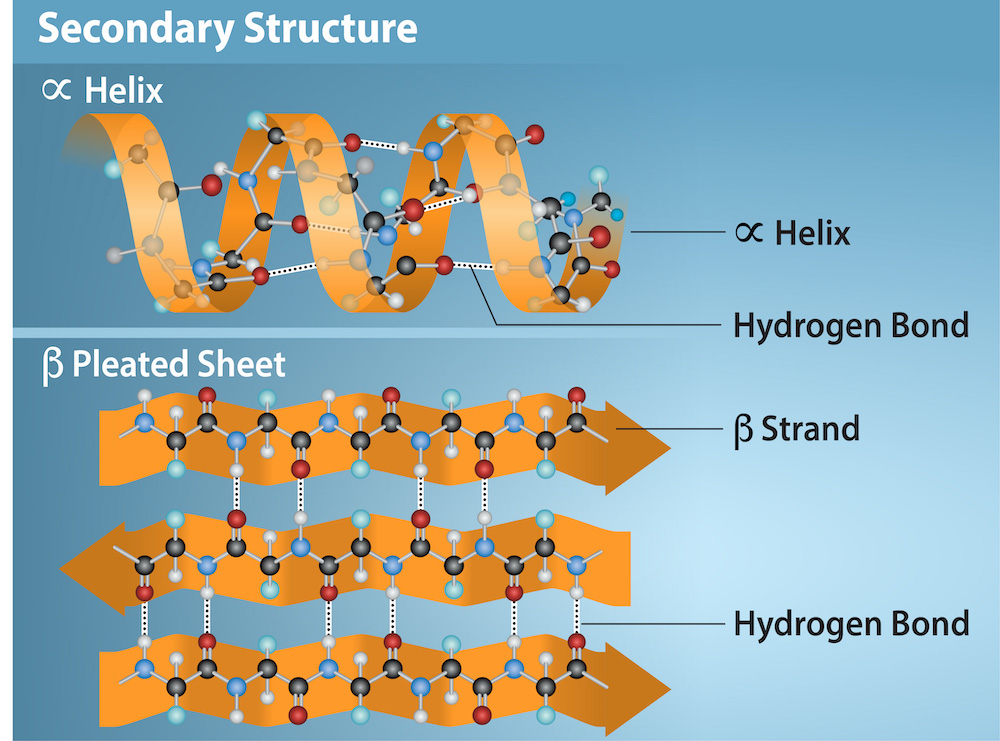
Figure 3: The α-helix and β-pleated sheet are secondary structures formed in proteins. These structures occur when hydrogen bonds form between the carbonyl oxygen and the amino hydrogen and nitrogen in the peptide backbone of two amino acids in a protein. Black = carbon, White = hydrogen, Blue = nitrogen, and Red = oxygen. Credit: Rao, A., Ryan, K. Fletcher, S. and Tag, A. Department of Biology, Texas A&M University. [Image Description]
Tertiary Structure
The polypeptide’s unique three-dimensional structure is its tertiary structure (Figure 4). This structure forms primarily due to chemical interactions between the side chains of amino acids in the polypeptide chain. The chemical nature of the side chain in the amino acids involved determines which amino acids are energetically favorable to be near other amino acids. For example, side chains with like charges repel each other and those with opposite charges are attracted to each other (ionic bonds). The sulfur atoms in cysteine side chains can form disulfide linkages in the presence of oxygen, the only covalent bond that forms during protein folding. When protein folding takes place, the nonpolar amino acids’ hydrophobic side chains repel water from the protein’s environment and pack into the protein’s interior; whereas, the hydrophilic side chains tend position on the surface of the protein as the protein folds, interacting with water. In general, whenever a protein is translated, it always folds into the same tertiary structure, as determined by the primary structure of its amino acids.
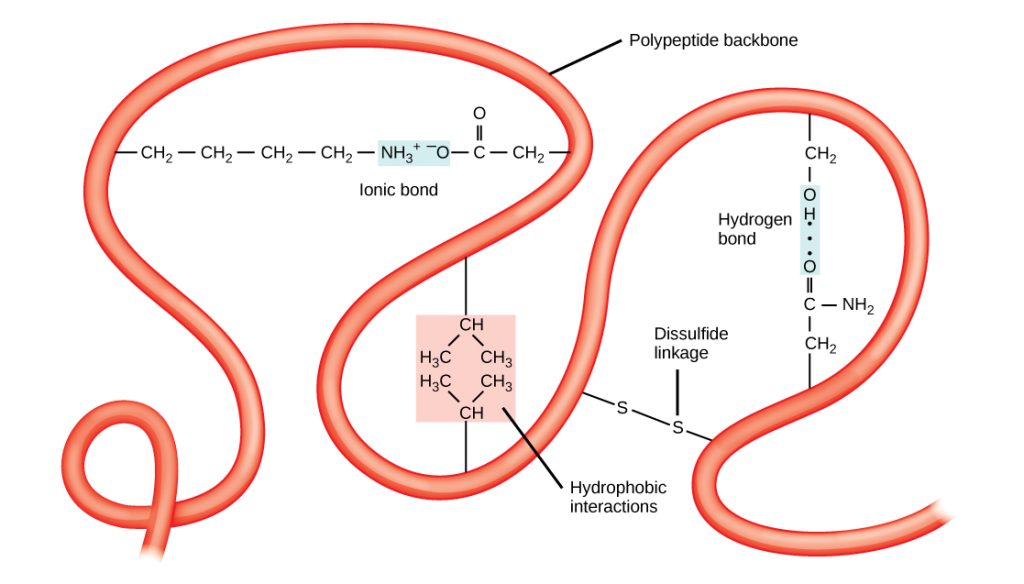
Figure 4: A variety of chemical interactions determine the proteins’ 3D, tertiary structure. These include hydrophobic interactions, ionic bonding, hydrogen bonding, and disulfide linkages. [Image Description]
Quaternary Structure
In nature, some – but not all – proteins form from several polypeptides, or subunits, and the interaction of these subunits forms the quaternary structure of the protein. Weak interactions between the subunits help to stabilize the overall structure. For example, the α and β chains of human hemoglobin, a globular protein, fold into a their tertiary structures, and then two copies of the α chain come into interact with two copies of the β chain to form a tetramer of four chains (Figure 5). Silk, a fibrous protein, however, has a β-pleated sheet structure that is the result of hydrogen bonding between many different chains.
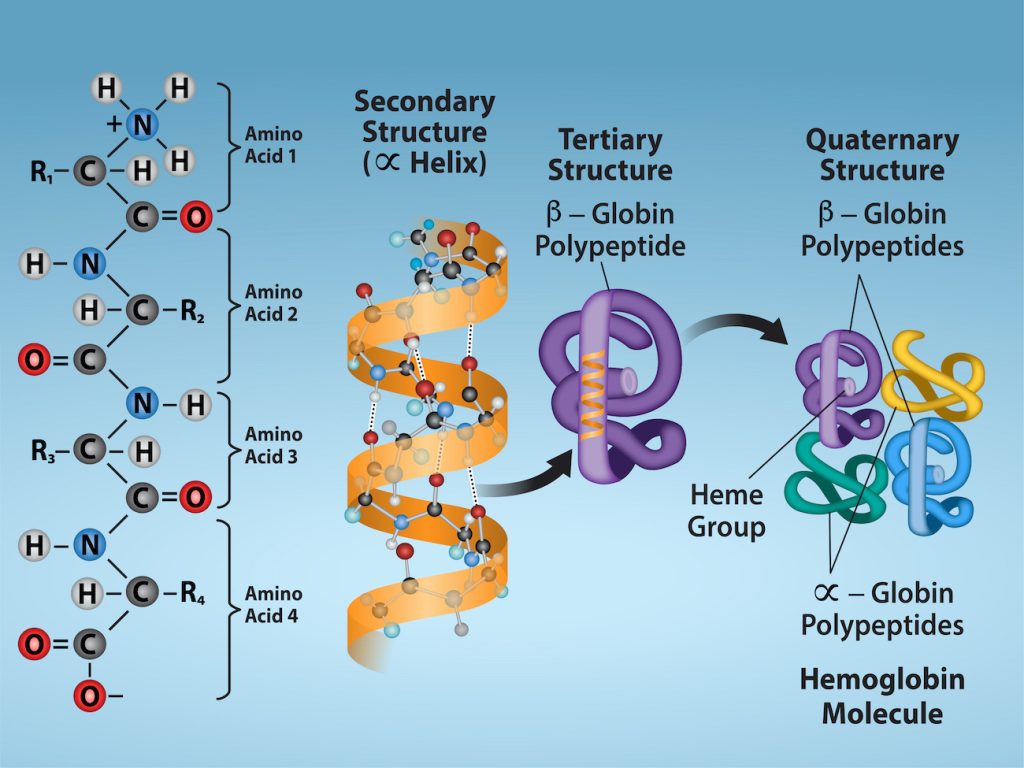
Figure 5: Primary, secondary, tertiary, and quaternary structure of hemoglobin. The primary structure of a hemoglobin is its amino acid sequence. It secondary structure is entirely α helices. Its tertiary structure is globular. Four protein chains come together to form the quaternary structure that is the functional hemoglobin protein. Credit: Rao, A. Ryan, K. and Tag, A. Department of Biology, Texas A&M University. [Image Description]
Practice Questions
2. Amino acids
Amino acids are the monomers that comprise the polymeric molecules, proteins. Each amino acid has the same fundamental structure, which consists of a central carbon atom, or the alpha carbon (Cα), bonded to an amino group (NH2), a carboxyl group (COOH), and a hydrogen atom. These atoms are considered the backbone of the amino acid. Every amino acid also has another atom or group of atoms bonded to the central Cα atom known as the R group or side chain (Figure 6).
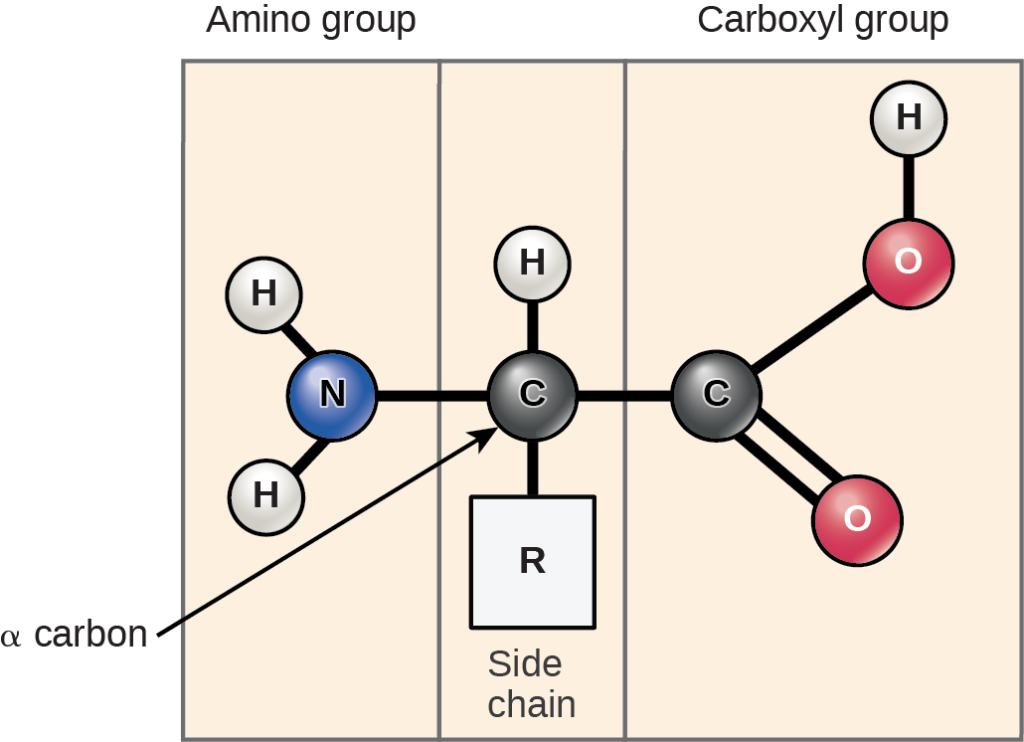
Figure 6: Structure of an amino acid. Amino acids have a central asymmetric carbon (Cα) to which an amino group, a carboxyl group, a hydrogen atom, and a side chain (R group) are covalently bonded. The R group is considered the side chain, and all atoms not in the R group are part of the backbone. [Image Description]
Practice Question
Scientists use the name “amino acid” because these acids contain both an amino group and a carboxylic acid group in their basic structure. The 20 common amino acids make up most of the proteins in our bodies. For each amino acid, the side chain (or R group) is different (Figure 7). The chemical nature of the side chain determines the amino acid’s chemical properties, such as whether it is acidic, basic, polar, or hydrophobic. Each amino acid has both a single-letter code and a three-letter abbreviation. For example, valine is abbreviated with the single letter V or the three-letter symbol, Val.
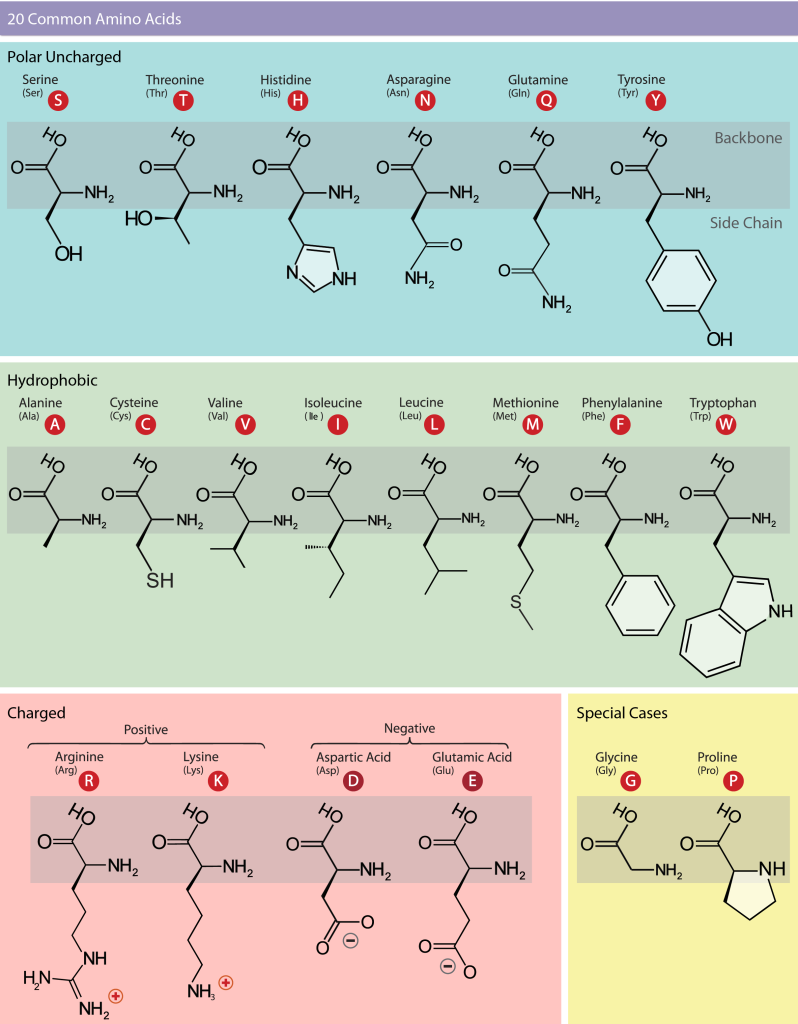
Figure 7: The 20 common amino acids. The chemical structure for each amino acid is given, grouped by chemical property. The single- and three-letter codes are also provided. Backbone atoms are indicated with a gray box. [Image Description]
The sequence and the number of amino acids ultimately determine the protein’s shape, size, and function. A covalent bond forms when the amino group from one amino acid reacts with the carboxyl group of another in a dehydration reaction, releasing a water molecule. In vivo this process happens in the ribosome. The resulting bond is the peptide bond (Figure 8), which has partial double-bond character due to resonance in the amide group.
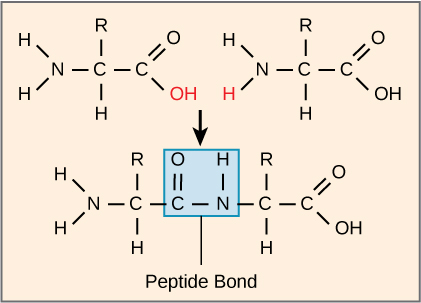
Figure 8: Peptide bond formation. The carboxyl group of one amino acid is linked to the incoming amino acid’s amino group. In the process, a water molecule is released. [Image Description]
The products that such linkages form are peptides. As more amino acids join to this growing chain, the resulting chain is a polypeptide. Each polypeptide has a free amino group at one end. This end is called the N terminus, or the amino terminus, and the other end has a free carboxyl group, also called the carboxyl or C terminus. When a polypeptide is built by the ribosome, amino acids are added from the N terminus to the C terminus. When polypeptide sequences are written out, they are likewise written from the N to C terminus. While the terms polypeptide and protein are sometimes used interchangeably, a polypeptide is technically a polymer of amino acids, whereas the term protein is used for a long polypeptide that is folded into its functional form.
Each of the 20 most common amino acids has specific chemical characteristics and a unique role in protein structure and function. Based on the propensity of the side chains to be in contact with water (polar environment), amino acids can be classified into three groups: 1) those with polar side chains, 2) those with hydrophobic side chains, and 3) those with charged side chains. Below we look at each of these classes and briefly discuss their role in protein structure and function.
Polar amino acids
When considering polarity, some amino acids are straightforward to define as polar, while in other cases, we may encounter disagreements. For example, serine (Ser, S), threonine (Thr, T), and tyrosine (Tyr, Y) are polar since they carry a hydroxylic (-OH) group (Figure 9). Furthermore, this group can form a hydrogen bond with another polar group by donating or accepting a proton (a table showing hydrogen bond donors and acceptors in polar and charged amino acid side chains can be found at the FoldIt site). Tyrosine is also involved in metal binding in many enzymatic sites. Asparagine (Asn, N) and glutamine (Gln, Q) also belong to this group and also may donate or accept a hydrogen bond.
Histidine (His, H), on the other hand, depending on the environment and pH, can be polar or carry a charge. It has two –NH groups with a pKa value of around 6. At pHs below 6, when both groups are protonated, the side chain has a charge of +1. Within protein molecules, the pKa may be modulated by the environment so that the side chain may donate a proton and become neutral or accept a proton, becoming charged. This ability makes histidine useful in enzyme active sites when the chemical reaction requires a proton extraction.
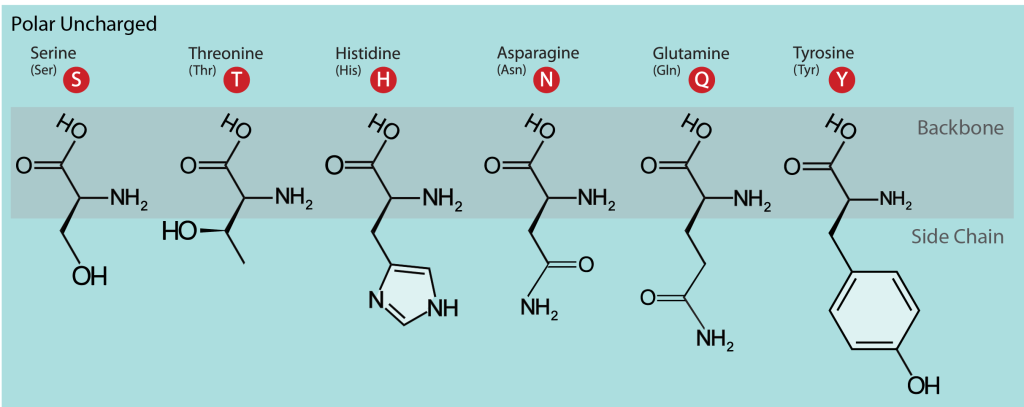
Figure 9: The polar amino acids. The single- and three-letter codes are provided and backbone atoms are indicated with a gray box. [Image Description]
Hydrophobic amino acids
The hydrophobic amino acids include alanine (Ala, A), cysteine (Cys, C), valine (Val, V), isoleucine (Ile, I), leucine (Leu, L), phenylalanine (Phe, F) and proline (Pro, P) (Figure 10). These residues typically form the hydrophobic core of proteins, which is isolated from the polar solvent. The side chains within the core are tightly packed and participate in van der Waals interactions, which are essential for stabilizing the tertiary structure of the protein. In addition, cysteine residues are involved in three-dimensional structure stabilization through the formation of disulfide (S-S) bridges between their sulfur atoms, which sometimes connect different secondary structure elements or different subunits in a complex. Another essential function of cysteine is metal binding, sometimes in enzyme active sites and sometimes in structure-stabilizing metal centers.
The aromatic amino acids tryptophan (Trp, W) and Tyr and the non-aromatic methionine (Met, M) are sometimes called amphipathic due to their ability to have both polar and nonpolar character. In protein molecules, these residues are often found close to the interface between a protein and solvent. A characteristic feature of aromatic residues is that they are often found within the core of a protein structure, with their side chains packed against each other, stabilized by π-π interactions. They are also highly conserved within protein families, with tryptophan having the highest conservation rate.
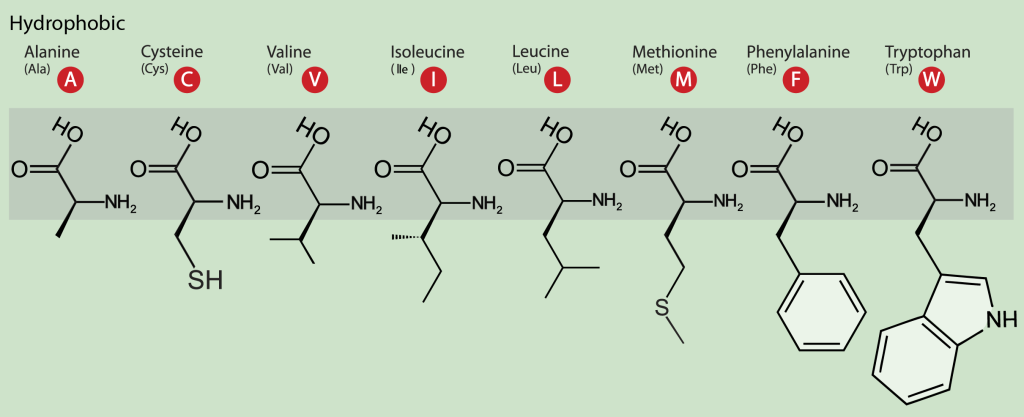
Figure 10: The hydrophobic amino acids. The single- and three-letter codes are provided and backbone atoms are indicated with a gray box. [Image Description]
Charged amino acids
The charged amino acids at neutral pH (around 7) carry a single charge in the side chain. There are four of them; the two basic ones are lysine (Lys, K) and arginine (Arg, R), with a positive charge at neutral pH. The two acidic residues are aspartate or aspartic acid (Asp, D) and glutamate or glutamic acid (Glu, E), which carry a negative charge at neutral pH (Figure 11). A so-called salt bridge is often formed by the interaction of closely located positively and negatively charged side chains. Such bridges are often involved in stabilizing three-dimensional protein structure, especially in proteins from thermophilic organisms, organisms that live at elevated temperatures, up to 80-90 C, or even higher. The binding of positively charged metal ions is another function of the negatively charged carboxylic groups of aspartate and glutamate. Metalloproteins and the role of metal centers in protein function is a fascinating field of structural biology research.
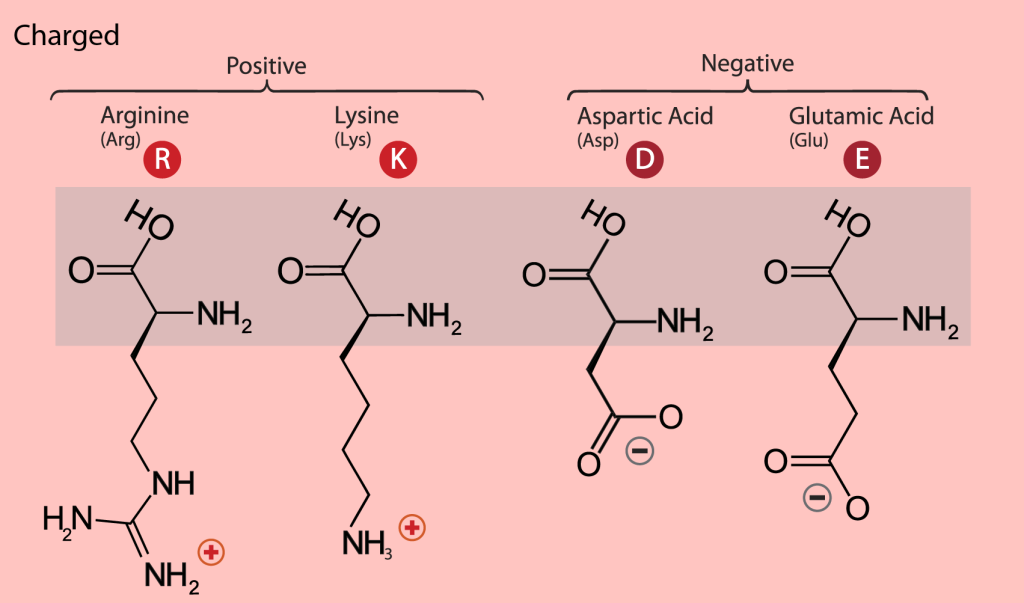
Figure 11: The charged amino acids. The single- and three-letter codes are provided and backbone atoms are indicated with a gray box. [Image Description]
Glycine & proline
Glycine (Gly, G), one of the common amino acids, does not have a side chain – its R group is just a hydrogen atom – and is often found at the surface of proteins within loop or coil regions (regions without defined secondary structure), providing high flexibility to the polypeptide chain. This flexibility is required in sharp polypeptide turns in loop structures. Proline (Pro, P), although considered hydrophobic, is also often found on the surface of proteins, presumably due to its presence in turn and loop regions. In contrast to glycine, which provides the polypeptide chain high flexibility, proline provides rigidity by imposing certain torsion angles on the segment of the structure. The reason for this is that its side chain makes a covalent bond with the main chain, which constrains the backbone shape of the polypeptide in this location. Sometimes proline is called a helix breaker since it is often found at the end of α-helices (Figure 12).
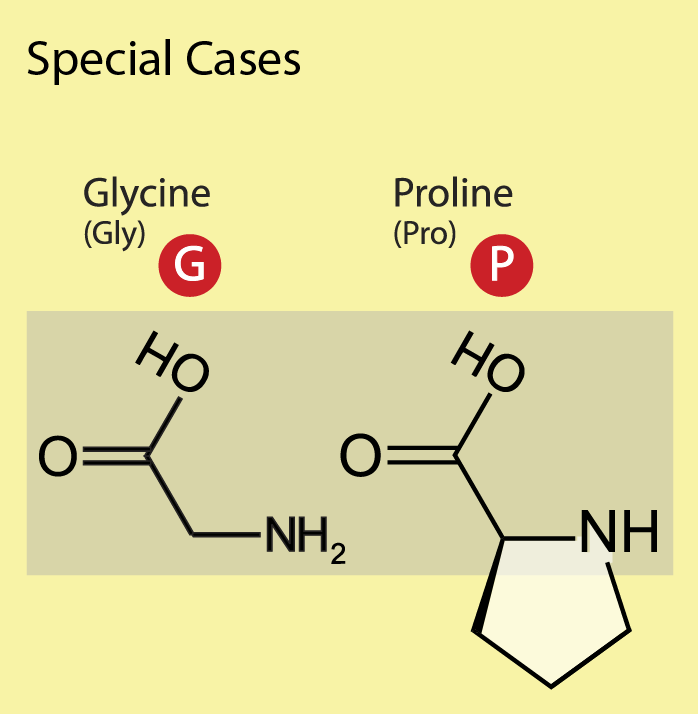
Figure 12: The special amino acids. The single- and three-letter codes are provided and backbone atoms are indicated with a gray box. [Image Description]
Practice Questions
3. Mutations
Genes can develop mutations due to the presence of mutagens or in the normal course of DNA replication. Some mutations in a gene’s DNA sequence can lead to substitution mutations in the amino acid sequence of the expressed protein. In this case, we would say that the wild type amino acid is changed to a different, mutant amino acid.
Substitution mutations can have a small, large, or no effect on the function of a protein. It’s impossible to predict the functional outcomes of mutations with certainty, based only on the protein’s structure, but we can make educated predictions.
Preliminary considerations
When predicting the functional outcome of a substitution mutation, the first thing to consider is proximity of the mutation to the functional region of the protein. The functional region refers to the amino acid residues in the protein that interact with whatever molecules are necessary for the protein to do its job. If the mutation is far away from the functional region, we would expect there to be less impact on the function of the protein than if it is in the functional region. That said, some mutations can cause overall instability of the protein, which would affect the function. However, we will not be focusing on those here.
The second thing to consider is the class of amino acid of the wild type and mutant. If both are the same class, we would predict there to be a smaller impact on function than if the classes were different. However, to make a more educated guess, we must look at the structure of the protein to assess the favorable and unfavorable interactions in the wild type and mutant amino acids.
Assessment of favorable interactions in the wild type
The third consideration is how important the wild type residue is to the function of the protein. If the wild type residue makes favorable interactions with a molecule that the protein must interact with to do its job, then changing the residue will have a larger negative impact on function.
Three favorable interactions that a residue may make are hydrogen bonds and salt bridges, together considered polar interactions, and hydrophobic interactions.
Perhaps the most important noncovalent interaction in biological molecules is the hydrogen bond, an attractive interaction between a hydrogen atom bonded to an electronegative O or N atom and an unshared electron pair on another O or N atom. In essence, a hydrogen bond is a very strong dipole–dipole interaction involving polarized O–H or N–H bonds. Electrostatic potential maps of water and ammonia clearly show the positively polarized hydrogens (blue) and the negatively polarized oxygens and nitrogens (red) (Figure 13) The electronegative atom that is covalently bound to the hydrogen atom is defined as the hydrogen bond donor, and the electronegative atom from the other residue or molecule is defined as the hydrogen bond acceptor.
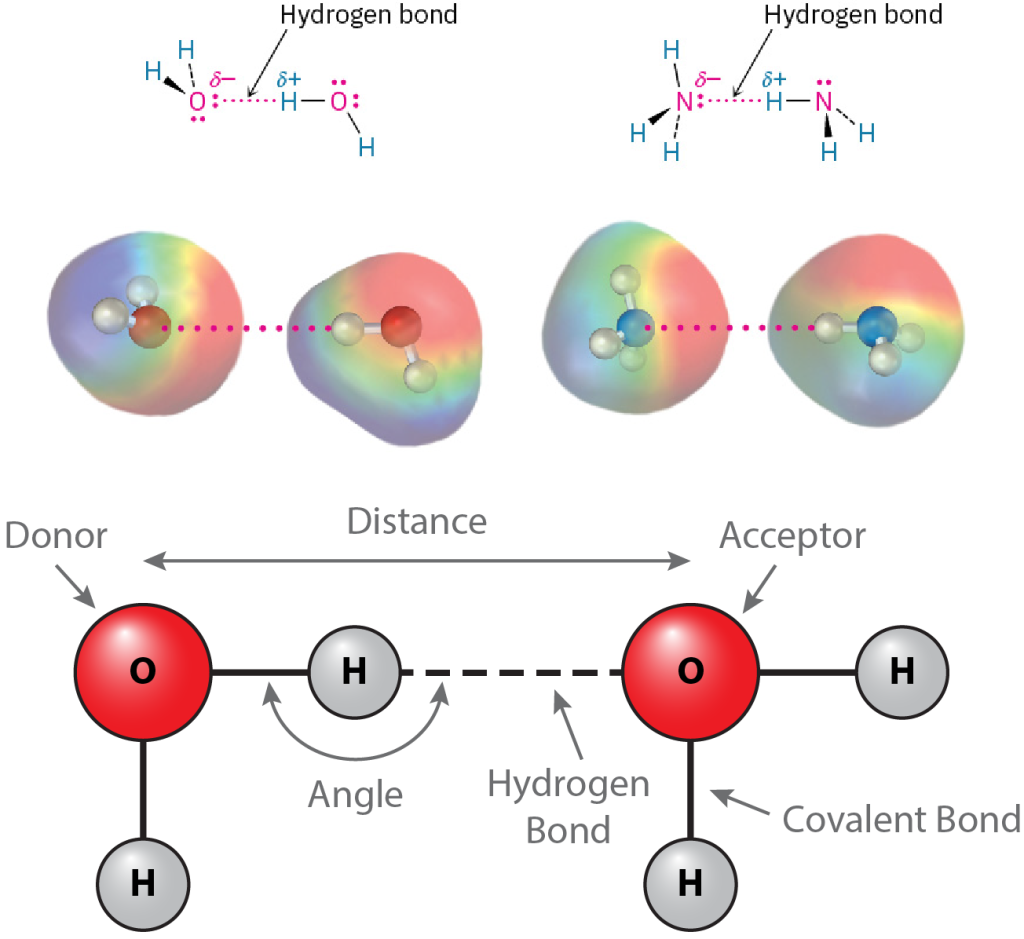
Figure 13: Hydrogen bond chemistry for water and ammonia. Hydrogen bonds are shown with partial charges (δ+/δ-) and electronegativity (negative red, positive blue) shown for each molecule’s atoms. Hydrogen bonds are noted as dotted lines because they are weaker than the covalent bonds joining the atoms within a molecule. [Image Description]
In proteins, hydrogen bonds may form between the O-H and N-H groups of polar or charged amino acids (Figure XX). The presence of hydrogen bonds may be predicted by the geometry of the atoms involved. The distance between the hydrogen bond donor and acceptor should be around 3-4 Å. The angle formed between the donor-hydrogen covalent bond and the hydrogen-acceptor hydrogen bond should be between 150-210°, which is another way of saying within 30° of linearity.
For Figures 14, 15, and 17, you can click and drag to view the functional regions in 3D. Zoom by scrolling or pinching. You can click or tap on the arrows in the top, right corner to make the model full screen.
Figure 14: Hydrogen bonds. A portion of the protein, streptavidin is shown in gray with its ligand, biotin in cyan. Hydrogen bonds are drawn as yellow-dotted lines, including one between the carbonyl group of biotin and Asn23. [Image Description]
The opposite charges of cations and anions exert a moderately strong mutual attraction that keeps the atoms in close proximity forming an ionic bond, or salt bridge. A salt bridge is an ongoing, close association between ions of opposite charge. The table salt you sprinkle on your food owes its existence to ionic bonding. The cation Na+ is strongly attracted to the chloride anion, Cl–.
In proteins, the charged amino acids may form salt bridges with each other, ions, or other charged molecules. Salt bridges occur between an anion and cation that are about 2-3 Å apart, and there is no optimal angle like for hydrogen bonds.
Figure 15: Salt bridges. A portion of the E. coli protein, polyphosphate kinase is shown in gray with its ligand, ATP in rose. Salt bridges are drawn as yellow-dotted lines, including one between the phosphate group of ATP and an Arg564. Two Mg2+ cations are shown as yellow spheres. [Image Description]
Dispersion forces occur between all neighboring molecules and arise because the electron distribution within molecules is constantly changing. Although uniform on a time-averaged basis, the electron distribution even in nonpolar molecules is likely to be nonuniform at any given instant. One side of a molecule may, by chance, have a slight excess of electrons relative to the opposite side, giving the molecule a temporary dipole. This temporary dipole in one molecule causes a nearby molecule to adopt a temporarily opposite dipole, resulting in a tiny attraction between the two (Figure 16). Temporary molecular dipoles have only a fleeting existence and are constantly changing, but their cumulative effect is often strong enough to hold molecules or amino acids close together.
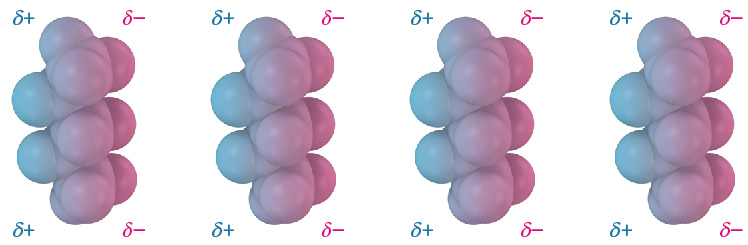
Figure 16: Dispersion forces. Attractive dispersion forces in nonpolar molecules are caused by temporary dipoles, as shown in these models of pentane, C5H12. [Image Description]
In proteins, we see dispersion forces manifested as hydrophobic interactions, where hydrophobic amino acids pack tightly together with the exclusion of water. These hydrophobic interactions are strongest when interacting atoms are spaced just beyond the sum of their van der Waals radii. Within hydrophobic amino acids, we would expect the aliphatic and aromatic carbon atoms to form hydrophobic interactions.
Figure 17: Hydrophobic interactions. A portion of the human dopamine transporter is shown in gray with its ligand, dopamine in green. Hydrophobic residues and dopamine are shown in spheres. Favorable hydrophobic interactions occur when the edges of the spheres of aliphatic or aromatic carbon atoms are almost touching, including between the benzene ring in dopamine and Phe326. [Image Description]
Connecting Concepts
For more on…
- Ions and covalent bonds, see Atoms, Ions and Molecules
- Electronegativity, hydrogen bonds, and van der Waals interactions, see Covalent Bonds and Other Molecular Interactions
- Aliphatic and aromatic carbons, see Carbon
Assessment of unfavorable interactions in the mutant
The fourth consideration is how damaging the mutant residue is to the function of the protein. If the mutant residue makes unfavorable interactions with a molecule that the protein must interact with to do its job, then it will have a large negative impact on function.
Just as cations and anions can interact favorably with each other to form a salt bridge, ions of the same charge repel each other in an effect called charge-charge repulsion. Inserting, a negatively charged amino acid in a functional region where a negatively charged molecule binds, for example, would be very unfavorable. In this case, the molecule would be repelled and no longer bind, so we would expect function to be lost.
Hydrogen bonds, salt bridges, and hydrophobic interactions all occur when atoms are at an ideal distance from each other. If atoms get too close together, shorter than the sum of their van der Waals radii, there are strong repulsive forces called a steric clash. If the mutant amino acid is bigger than the wild type, it may form steric clashes with the other amino acids around it or the other molecules that need to bind in the functional region. In our predicted structures, we will see this as molecules overlapping, but in vivo, molecules cannot actually overlap. Instead, the protein will rearrange its structure to accommodate the larger amino acid and/or the molecule will not be able to get into the functional region to bind.
Making a prediction
When we use a protein’s structure to make a prediction about whether the mutation will have a large, small, or no effect on function, we must consider:
- The proximity of the mutation to the functional region
- The class of amino acid of the wild type and mutant
- The favorable interactions in the wild type that are lost
- The unfavorable interactions in the mutant that are gained
If the mutation is outside the functional region, we will predict that there will be no effect on function.
If the wild type and mutant residues are both within the same class of amino acids, we would generally predict a less disruptive mutation than if they were in different classes. However, if a structure is available, it is preferable to assess the atomic interactions.
If the wild type residue makes a favorable interaction with other residues or a molecule that binds in the functional region, we would predict a medium-to-large loss of function. The more favorable the interaction, the larger loss of function we would predict. If this interaction is not maintained in the mutant, we would again predict a larger loss of function. Even if the favorable interaction is maintained in the mutant, we would probably predict at least a small loss of function. Functional regions are highly optimized evolutionarily, and any single amino acid change was probably selected against already.
If the mutant residue makes an unfavorable interaction with other residues or a molecule that binds in the functional region, we would predict a complete loss of function.
Practice Questions
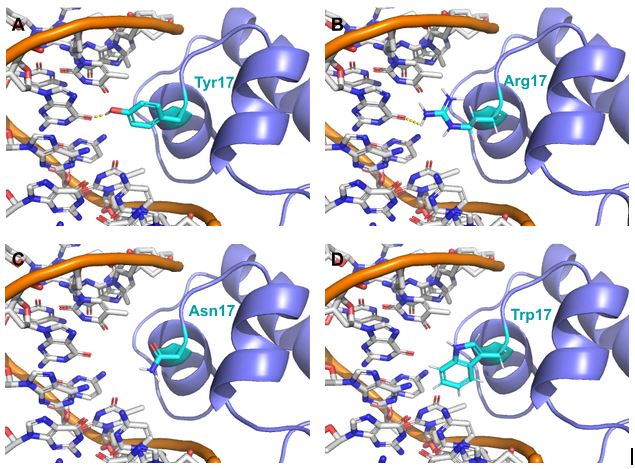
Structures of E. coli LacI repressor mutants bound to DNA.
LacI repressor (purple cartoon) is modeled bound to DNA (orange backbone, white nucleotides) with its residue 17 in cyan sticks. Oxygen atoms are red, and Nitrogen is blue. Predicted hydrogen bonds are shown in dotted, yellow lines. (A) Wild type Tyr 17 and possible mutants (B) Arg 17, (C) Asn 17, and (D) Trp 17.
Image Descriptions
Figure 2: The image is a comparative illustration of the structural and functional differences between normal hemoglobin and sickle-cell hemoglobin across various levels of protein structure. The layout is divided into two vertical sections labeled “Normal” and “Sickle-Cell,” each with subsections depicting the primary, secondary, tertiary, quaternary structures, and function.
- Primary Structure:
- Normal: Seven circular molecules labeled sequentially from 1 to 7 with the respective amino acids: Val, His, Leu, Thr, Pro, Glu, Glu.
- Sickle-Cell: Same seven circular molecules labeled sequentially with the amino acids: Val, His, Leu, Thr, Pro, Val, Glu. The sixth molecule, Glu, is replaced with Val, highlighted in red.
- Secondary and Tertiary Structures:
- Normal: A blue 3D ellipsoid shape representing the normal β subunit.
- Sickle-Cell: A reddish-brown 3D ellipsoid shape representing the sickle-cell β subunit.
- Quaternary Structure:
- Normal: Combination of blue and purple ellipsoid shapes to form normal hemoglobin.
- Sickle-Cell: Combination of reddish-brown and purple ellipsoid shapes to form sickle-cell hemoglobin.
- Function:
- Normal: Depicts individual globular hemoglobin molecules scattered and unassociated, each capable of carrying oxygen.
- Sickle-Cell: Illustrates abnormal aggregation of hemoglobin molecules into fibers, impairing oxygen-carrying capacity.
Figure 3: The image illustrates two types of secondary protein structures against a light blue background: an alpha-helix and a beta-pleated sheet. The illustration is divided horizontally into two sections.
- Top Section: Alpha Helix
- A right-handed helical structure is shown in orange, twisting in a clockwise direction.
- The helix is depicted with a string of colored spheres (atoms) connected by lines (chemical bonds) representing the molecular structure.
- Hydrogen bonds are represented by dashed lines connecting parts of the helix.
- The labels include “α Helix” and “Hydrogen Bond”.
- Bottom Section: Beta Pleated Sheet
- Several strands are aligned next to each other, forming a pleated sheet structure in orange.
- Similar to the helix, the strands are composed of colored spheres (atoms) connected by lines (chemical bonds).
- Hydrogen bonds are depicted as dashed lines running perpendicular to the strands, connecting adjacent strands.
- The labels include “β Pleated Sheet,” “β Strand,” and “Hydrogen Bond”.
Figure 4: The image depicts a simplified diagram of a polypeptide backbone, illustrating various interactions and bonds that occur within a protein structure. The backbone is represented by a red, ribbon-like structure that loops and twists, showing the complex folding of the protein.
- Polypeptide Backbone: The main red ribbon represents the polypeptide backbone which loops around the image.
- Ionic Bond: There is a highlighted section showing a segment with a labeled “Ionic Bond,” featuring an NH₃⁺ group connected to an O⁻ group.
- Hydrogen Bond: A light blue segment indicates a “Hydrogen bond” between O-H groups.
- Disulfide Linkage: An adjacent part shows a connection labeled “Disulfide linkage” marked by two sulfur atoms connected by a line (represented by “S-S”).
- Hydrophobic Interactions: Another section indicates “Hydrophobic interactions,” involving CH₃ groups interacting with one another.
Figure 5: The image illustrates the hierarchical structure of proteins from the primary structure to the quaternary structure, using hemoglobin as an example. The background is a gradient blue, transitioning from a darker blue at the top to a lighter blue at the bottom.
From left to right:
- Primary Structure: Depicts a sequence of amino acids connected via peptide bonds. Four amino acids are shown (labeled 1, 2, 3, and 4). Each amino acid consists of an amino group (NH2), carboxyl group (COOH), hydrogen atom (H), and side chain (R1, R2, R3, R4).
- Secondary Structure (α Helix): Shows the formation of an alpha helix from the amino acid chain. The helix is represented by an orange spiraling ribbon with dotted lines indicating hydrogen bonds stabilizing the structure.
- Tertiary Structure: Illustrates a β-globin polypeptide chain folded into a specific three-dimensional shape. It appears as a purple, looped, and twisted structure.
- Quaternary Structure: Demonstrates the assembly of multiple polypeptide chains. The β-globin (purple) and α-globin (yellow, green, and blue) polypeptides combine to form a hemoglobin molecule.
Figure 6: The image is a diagram depicting the structure of an amino acid. The diagram is divided into three sections vertically, from left to right, labeled “Amino group,” “Side chain,” and “Carboxyl group.” The amino group section contains a nitrogen atom (N) colored blue at the center, bonded to two hydrogen atoms (H) represented in white and labeled. Moving rightwards, the central section contains a carbon atom (C) depicted in black, bonded to one hydrogen atom (H) in white and to an “R” group representing the side chain. The carbon is also bonded to another carbon atom (C), also in black, positioned to the right in the carboxyl group section. This carbon is double-bonded to an oxygen atom (O) colored in red, and single-bonded to another oxygen (O) with a single hydrogen (H) attached. An arrow points to the central carbon labeled “α carbon.” [Return to Figure]
Figure 7: The image is an educational chart titled “20 Common Amino Acids.” It is divided into four main sections by backgrounds of different colors: Polar Uncharged (light blue), Hydrophobic (light green), Charged (light pink), and Special Cases (light yellow).
- Polar Uncharged (light blue background):
- Contains six amino acids: Serine (S), Threonine (T), Histidine (H), Asparagine (N), Glutamine (Q), and Tyrosine (Y).
- Each amino acid is depicted with its chemical structure and a red circle indicating its one-letter code inside the circle.
- Hydrophobic (light green background):
- Contains nine amino acids: Alanine (A), Cysteine (C), Valine (V), Isoleucine (I), Leucine (L), Methionine (M), Phenylalanine (F), and Tryptophan (W).
- Each amino acid is depicted with its chemical structure and a red circle indicating its one-letter code inside the circle.
- Charged (light pink background):
- Divided into Positive and Negative sections.
- The Positive section includes Arginine (R) and Lysine (K).
- The Negative section includes Aspartic Acid (D) and Glutamic Acid (E).
- Each amino acid is depicted with its chemical structure and a red circle indicating its one-letter code inside the circle.
- Special Cases (light yellow background):
- Contains two amino acids: Glycine (G) and Proline (P).
- Each amino acid is depicted with its chemical structure and a red circle indicating its one-letter code inside the circle.
- The top left structure represents an amino acid, featuring an amino group (H2N), a central carbon (C) bonded to a hydrogen atom (H), a variable side chain (R), and a carboxyl group (COOH). The hydroxyl group (OH) in the carboxyl group is highlighted in red.
- The top right structure represents another amino acid with a similar structure but differing variable side chains (R).
- The two structures at the top are separated by a space and linked by an arrow pointing to a single structure at the bottom.
- The bottom structure represents the resulting dipeptide with a peptide bond formed. The peptide bond is highlighted within a blue rectangle, showing the linkage between the carbon (C) of one amino acid and the nitrogen (N) of the other amino acid.
- The term “Peptide Bond” is written below the blue rectangle.
Figure 9: The image categorizes polar uncharged amino acids and visually represents their structures. It displays six amino acids: Serine, Threonine, Histidine, Asparagine, Glutamine, and Tyrosine. Each amino acid shows its backbone and distinct side chain. The background is light blue, with the structures depicted in black. Each amino acid name is followed by its three-letter and one-letter code, represented within a red circle. [Return to Figure]
Figure 10: The image is a diagram depicting the molecular structures of eight hydrophobic amino acids. The background is light green, and each amino acid is illustrated with its chemical structure, the three-letter abbreviation, and the single-letter code. The amino acids are aligned horizontally. From left to right, the amino acids are Alanine (Ala, A), Cysteine (Cys, C), Valine (Val, V), Isoleucine (Ile, I), Leucine (Leu, L), Methionine (Met, M), Phenylalanine (Phe, F), and Tryptophan (Trp, W). Each single-letter code is presented in a red circle. [Return to Figure]
Figure 11: The image is a diagram that categorizes amino acids based on their charge properties and atomic structure. The background is a light pink color, and there is a shaded rectangular area in the center where the chemical structures are displayed. The diagram is divided into two main groups labeled “Positive” and “Negative”. Under the “Positive” group, two amino acids are listed: Arginine (Arg) and Lysine (Lys), each represented with their respective chemical structures and a red circle with the letters “R” and “K”. Under the “Negative” group, two amino acids are listed: Aspartic Acid (Asp) and Glutamic Acid (Glu), each represented with their respective chemical structures and a red circle with the letters “D” and “E”. [Return to Figure]
The image has a yellow background and is titled “Special Cases” at the top in black font. Below the title, there are two sections dedicated to the amino acids Glycine (Gly) and Proline (Pro).
To the left, under the heading “Glycine (Gly)” in black text, there is a red circle with a white uppercase letter “G” inside. Below this, a structural formula of Glycine is depicted within a beige rectangle. The formula shows a carbon atom bonded to an amine group (NH₂), a carboxyl group (COOH), and two hydrogen atoms.
To the right, under the heading “Proline (Pro)” in black text, there is a red circle with a white uppercase letter “P” inside. Below this, a structural formula of Proline is also shown within the same beige rectangle. The Proline structure shows a carbon atom bonded to a carboxyl group (COOH), an amine group in a five-membered ring structure, and single hydrogen atoms.
The image consists of diagrams illustrating the concept of hydrogen bonding. At the top, there are two small diagrams with molecular structures showing hydrogen bonds. The first diagram depicts two water molecules, where the hydrogen atom of one molecule is connected with a dotted pink line to the oxygen atom of another, depicting a hydrogen bond. The atoms are labeled with partial charges: oxygen labeled as δ- and hydrogen as δ+. The same labeling and connection style are shown in the second diagram but with two ammonia molecules, where the hydrogen atom of one ammonia molecule forms a hydrogen bond with the nitrogen atom of the other.
Below these, there are colorful 3D molecular models corresponding to the structural diagrams. Each molecule is represented with a colored gradient: rainbow-like for electron clouds around the molecules, highlighting the areas of interaction. The hydrogen bonds are also denoted with dotted pink lines.
At the bottom, there is a larger diagram showing a simplified representation of hydrogen bonding between two water molecules. The donor and acceptor oxygen atoms are in red, connected by a dashed line indicating the hydrogen bond. The diagram also labels the hydrogen bonds, covalent bonds, bond angles, and distances between molecules.
Figure 14: The image shows a 3D model of a protein structure, with a focus on a ligand interaction. The protein is represented using a ribbon diagram, depicted in shades of gray, indicating its secondary structural elements. The beta-sheets are represented by broad, flat arrows, while coils and loops are depicted as thinner, winding lines. The ligand, likely a small organic molecule, is depicted in bright cyan, showing a hexagonal ring structure with various extensions. Yellow dashed lines illustrate potential hydrogen bonds or interactions between the ligand and protein’s amino acid residues. The atoms within the structure are color-coded: nitrogen atoms in blue, oxygen in red, carbon primarily in gray, and the ligand’s carbon atoms in a distinct cyan. This color differentiation highlights areas of interaction and molecular geometry. [Return to Figure]
Figure 15: The image depicts a molecular structure rendered in 3D. It features a complex arrangement of twisted and coiled lines representing the backbone of a protein structure, depicted in grey. Intertwined within this arrangement are several molecules and atoms highlighted with different colors. Two prominent green spheres represent large atoms or ions placed centrally within the image, while smaller atomic structures in blue, red, and pink form a chain-like configuration, possibly symbolizing a chemical compound or ligand interacting with the protein. Yellow dashed lines indicate potential interactions or bonds between the different molecular components. [Return to Figure]
Figure 16: The image showcases a series of four identical models, each representing a molecule structure composed of spheres connected in a linear formation. The molecule models feature a gradient of blue and pink colors, with the blue hue indicating a partial positive charge (δ+) and the pink hue indicating a partial negative charge (δ−). Each model consists of five spheres aligning vertically. The blue spheres are positioned on the left side, and the pink spheres are on the right side. Above each group of blue spheres is the text δ+, and above each group of pink spheres is the text δ−. [Return to Figure]
Figure 17: The image depicts a three-dimensional molecular structure of a protein. The protein is represented by a series of intertwined, gray ribbon-like helices. Among these helices, a cluster of colored spheres representing different atoms is visible, with green, red, blue, and other colors indicating various elements. The helices wrap around the cluster, creating a complex structure that is compact and tightly bound. The background is white, allowing the structure to stand out clearly. [Return to Figure]
Licenses and Attributions
“Protein Structure & Function” by Michelle McCully is adapted from “3.4 Proteins” by Mary Ann Clark, Matthew Douglas, Jung Choi for OpenStax Biology 2e used under CC BY 4.0; “The 20 Amino Acids and Their Role in Protein Structures” by Salam Al-Karadaghi used under CC BY-NC-SA 4.0; and “2.12 Noncovalent Interactions between Molecules” by John McMurry, Professor Emeritus for OpenStax Organic Chemistry 2e used under CC BY-NC-SA 4.0. “Protein Structure & Function” is licensed under CC BY-NC-SA 4.0.
Media Attributions
- Sickle Cell Anemia-XY © Rao, A., Tag, A. Ryan, K. and Fletcher, S. Department of Biology, Texas A&M University) is licensed under a CC BY (Attribution) license
- 1C-J-3.1 Figure – secondary structure © Rao, A., Ryan, K. Fletcher, S. and Tag, A. Department of Biology, Texas A&M University. is licensed under a CC BY (Attribution) license
- 1C-J-3.1 Figure – tertiary structure is licensed under a CC BY (Attribution) license
- 3.29 and 3.30 Protein Structure-ZZ © Rao, A. Ryan, K. and Tag, A. Department of Biology, Texas A&M University is licensed under a CC BY (Attribution) license
- 1C-J-3.2 Figure – amino acid is licensed under a CC BY (Attribution) license
- 1C-J-3.2 Figure – 20 amino acids © Dan Cojocari adapted by Michelle McCully is licensed under a CC BY-SA (Attribution ShareAlike) license
- 1C-J-3.2-Figure-peptide-bond is licensed under a CC BY (Attribution) license
- 1C-J-3.2 Figure – polar amino acids © Dan Cojocari adapted by Michelle McCully is licensed under a CC BY-SA (Attribution ShareAlike) license
- 1C-J-3.2 Figure – hydrophobic amino acids © Dan Cojocari adapted by Michelle McCully is licensed under a CC BY-SA (Attribution ShareAlike) license
- 1C-J-3.2 Figure – charged amino acids © Dan Cojocari adapted by Michelle McCully is licensed under a CC BY-SA (Attribution ShareAlike) license
- 1C-J-3.2 – Figure – special amino acids © Dan Cojocari adapted by Michelle McCully is licensed under a CC BY-SA (Attribution ShareAlike) license
- 1C-J-3.3 Figure – hydrogen bonds chemistry © John McMurry, Professor Emeritus adapted by Michelle McCully is licensed under a CC BY-NC-SA (Attribution NonCommercial ShareAlike) license
- 1C-J-3.3 Figure – dispersion forces © John McMurry, Professor Emeritus is licensed under a CC BY-NC-SA (Attribution NonCommercial ShareAlike) license
- 1C-J-3.3 Quiz Image – mutations © Michelle McCully is licensed under a CC BY-NC (Attribution NonCommercial) license
