The Endomembrane System
Melissa Hardy
Learning Objectives
By the end of this chapter, you will be able to do the following:
- Understand the role of the endomembrane system in protein modification, packaging and intracellular transport
Although the translation of mRNAs whose protein products function in the cytoplasm takes place on free-floating ribosomes, there are a subset of mRNAs that must go through a slightly modified translation process, namely those that code for membrane or secreted proteins or proteins that function in the lumen of organelles that make up the endomembrane system.
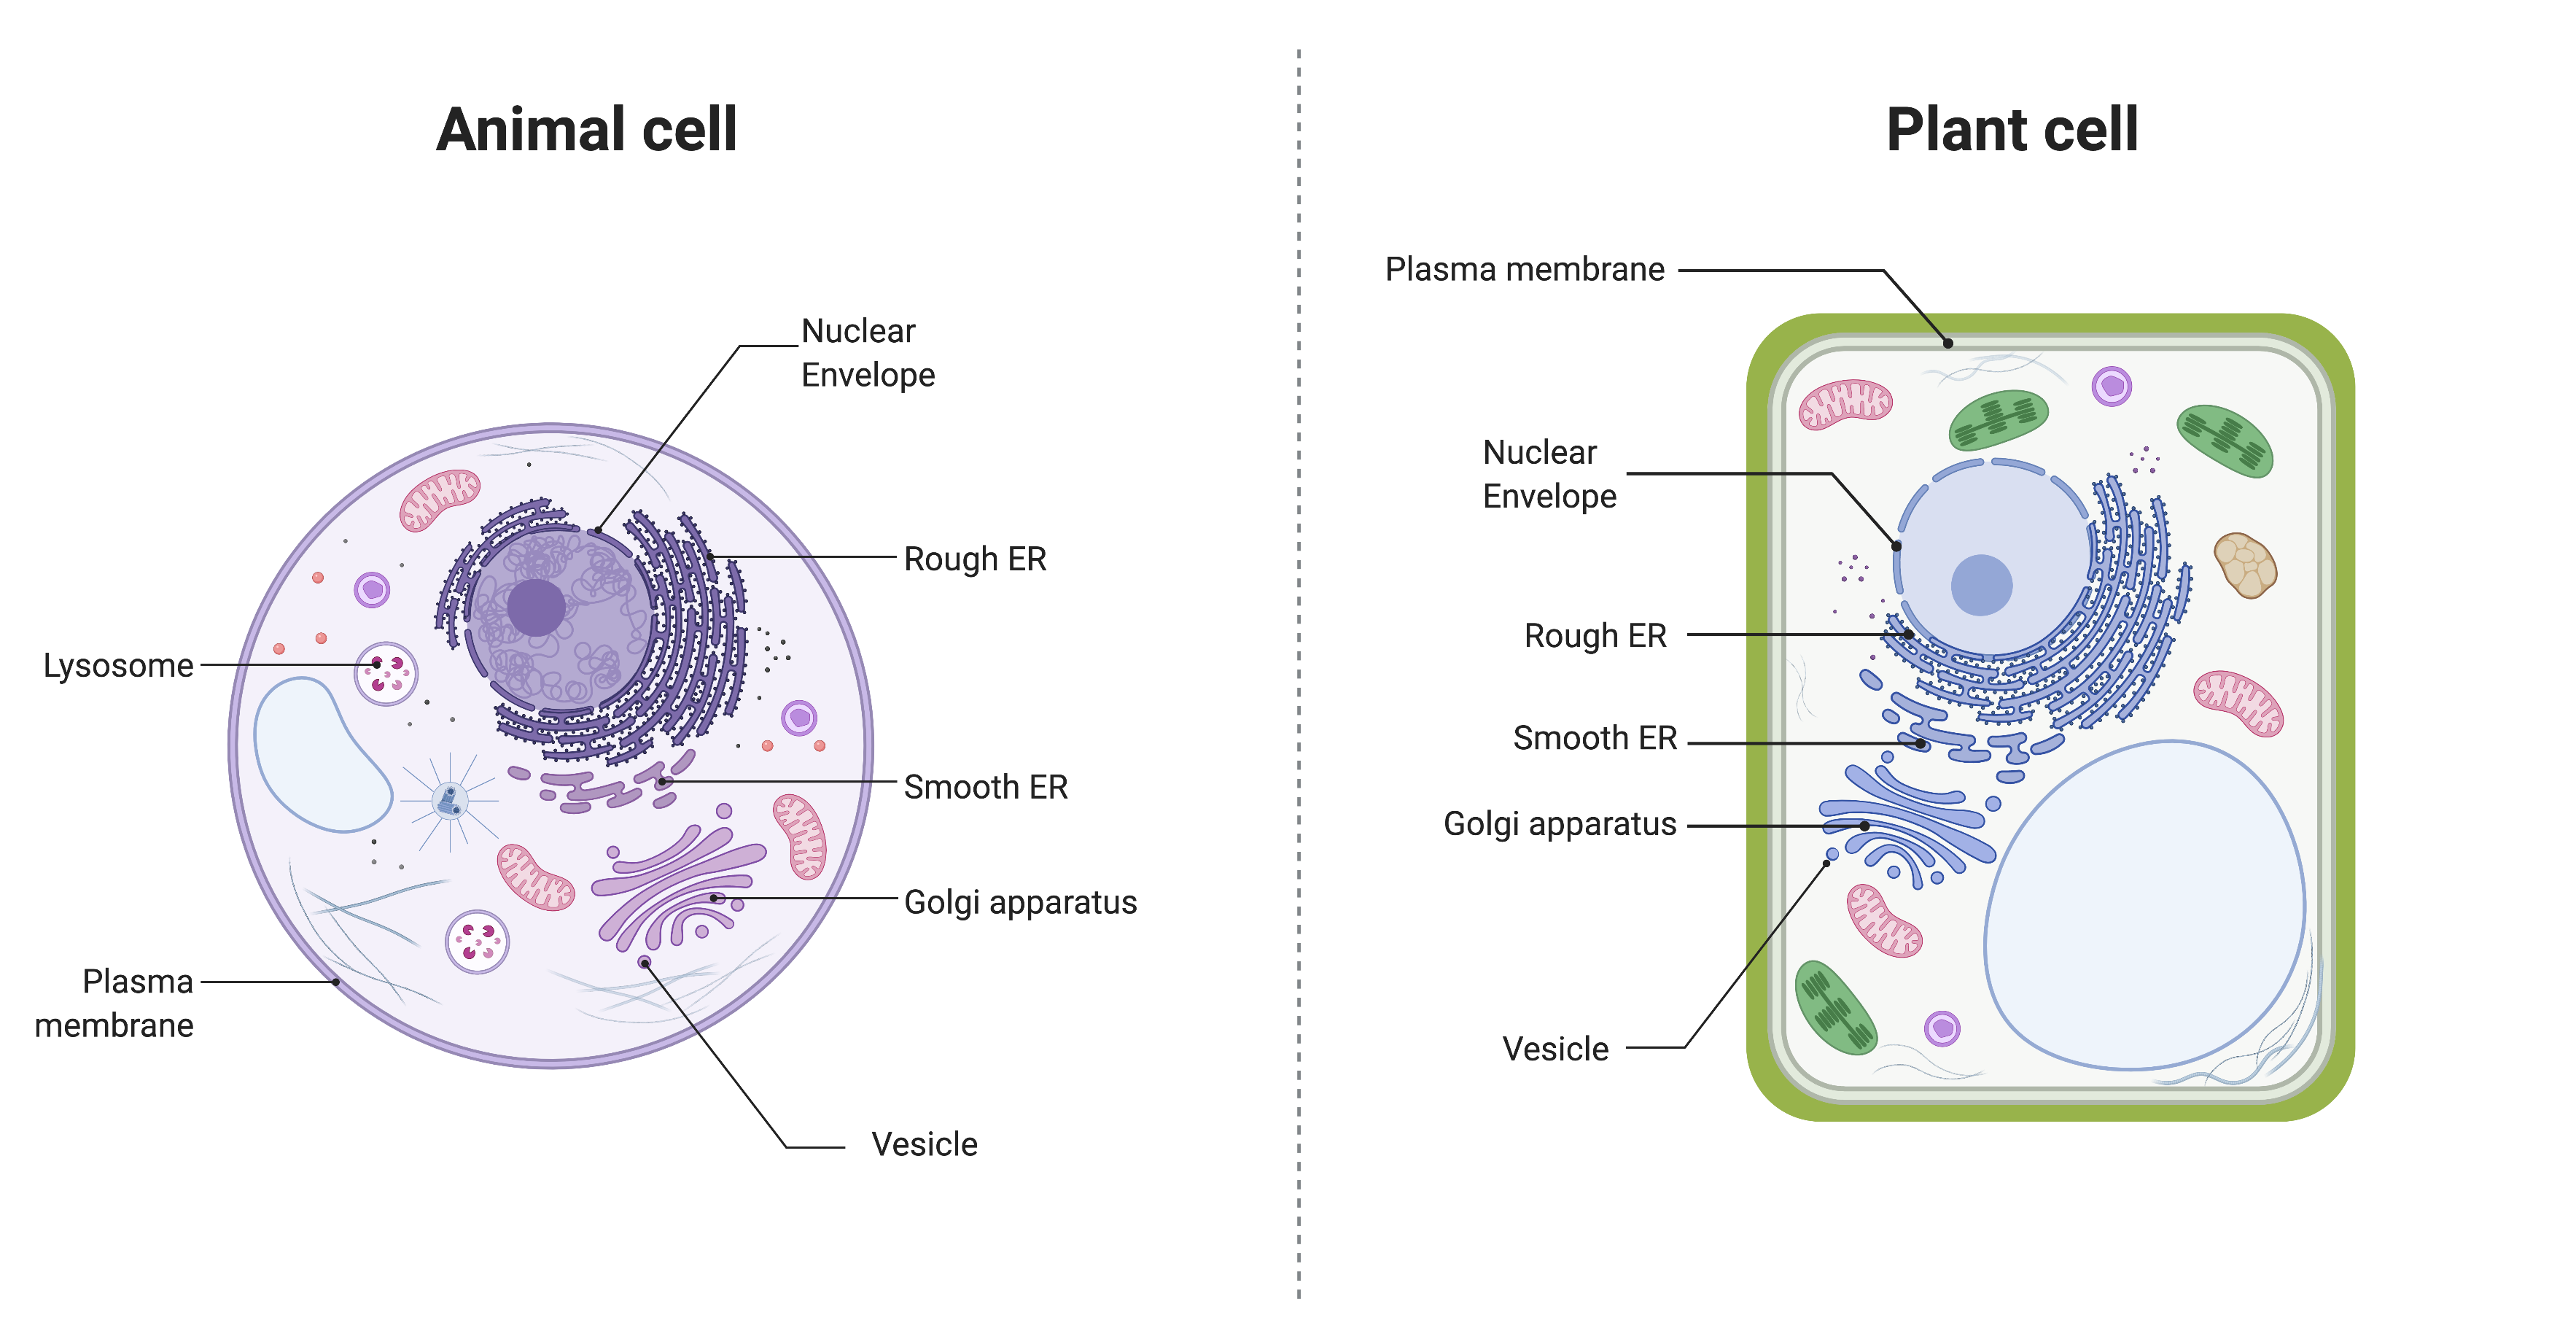
The endomembrane system (endo = “within”) is a group of membranes and organelles in eukaryotic cells that works together to modify, package, and transport lipids and proteins. It includes the nuclear envelope, lysosomes, vesicles, endoplasmic reticulum, and Golgi apparatus. Although not technically within the cell, the plasma membrane is included in the endomembrane system because it interacts with the other endomembranous organelles. You can review the structure and key features of the plasma membrane here. The endomembrane system does not include either mitochondria or chloroplast membranes.

The Endoplasmic Reticulum
The endoplasmic reticulum (ER) is a series of interconnected membranous sacs and tubules that collectively modifies proteins and synthesizes lipids. However, these two functions take place in separate areas of the ER: the rough ER and the smooth ER, respectively.
We call the interior portion of the ER the lumen. The ER’s membrane, which is a phospholipid bilayer embedded with proteins, is continuous with the nuclear envelope.

Rough ER
Scientists have named the rough endoplasmic reticulum (RER) as such because the ribosomes attached to its cytoplasmic surface give it a studded appearance when viewing it through an electron microscope.
Ribosomes can be classified as either free or membrane-bound. Free ribosomes exist in the cytosol and are not associated with a membrane. Membrane-bound ribosomes are attached to the outside of the membrane of the endoplasmic reticulum. Free and membrane-bound ribosomes are identical in structure; they differ only in location. In fact, an individual ribosome may sometimes be free and sometimes be membrane-bound, depending on what type of protein it is producing.
Free ribosomes generally produce proteins that will be used within the cytoplasm. Membrane-bound ribosomes generally produce proteins that will either be embedded in a membrane, or secreted from the cell.
If the phospholipids or modified proteins are not destined to stay in the RER, they will reach their destinations via transport vesicles that bud from the RER’s membrane.
Since the RER is engaged in modifying proteins (such as enzymes, for example) that secrete from the cell, you would be correct in assuming that the RER is abundant in cells that secrete proteins. This is the case with liver cells, for example.
Smooth ER
The smooth endoplasmic reticulum (SER) is continuous with the RER but has few or no ribosomes on its cytoplasmic surface. SER functions include synthesis of carbohydrates, lipids, and steroid hormones; detoxification of medications and poisons; and storing calcium ions. In muscle cells, a specialized SER, the sarcoplasmic reticulum, is responsible for storing calcium ions that are needed to trigger the muscle cells’ coordinated contractions.
The Golgi Apparatus
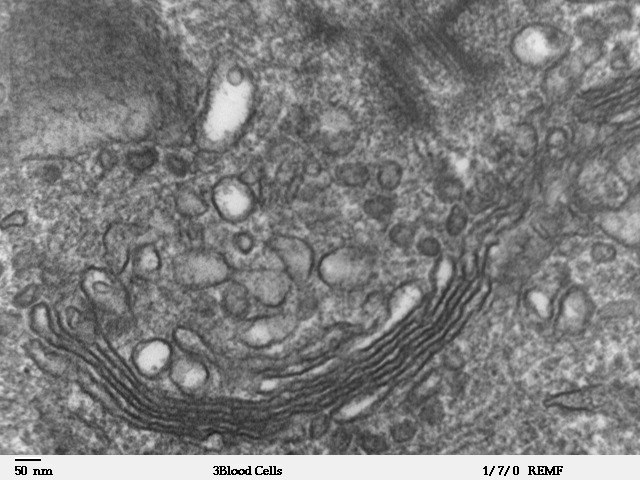
We have already mentioned that vesicles can bud from the ER and transport their contents elsewhere, but where do the vesicles go? Before reaching their final destination, the lipids or proteins within the transport vesicles still need sorting, packaging, and tagging so that they end up in the right place. Sorting, tagging, packaging, and distributing lipids and proteins takes place in the Golgi apparatus (also called the Golgi body), a series of flattened membranous sacs.

The side of the Golgi apparatus that is closer to the ER is called the cis face. The opposite side is the trans face. The transport vesicles that formed from the ER travel to the cis face, fuse with it, and empty their contents into the Golgi apparatus’ lumen. As the proteins and lipids travel through the Golgi, they undergo further modifications that allow them to be sorted. The most frequent modification is adding short sugar molecule chains. These newly modified proteins and lipids are then tagged with phosphate groups or other small molecules in order to travel to their proper destinations.

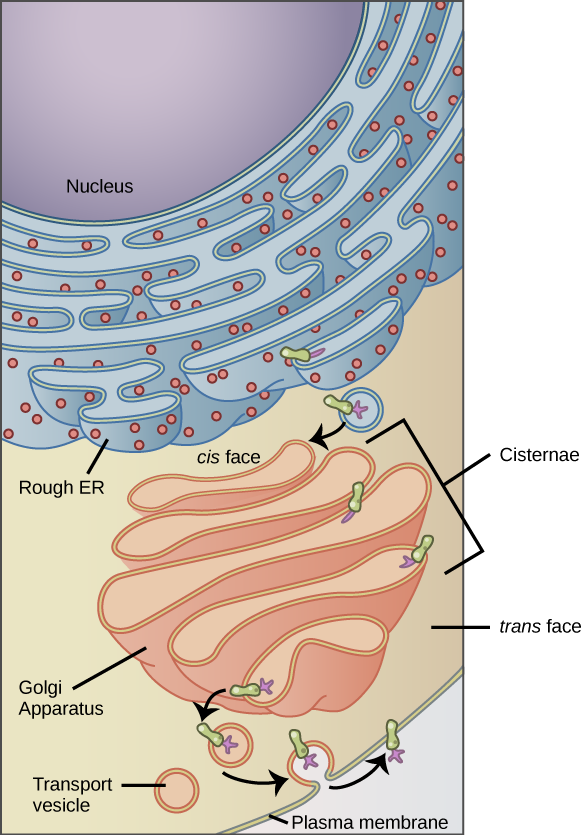
Finally, the modified and tagged proteins are packaged into transport vesicles that bud from the Golgi’s trans face. While some of these vesicles deposit their contents into other cell parts where they will be used, other secretory vesicles fuse with the plasma membrane and release their contents outside the cell.
In another example of form following function, cells that engage in a great deal of secretory activity (such as salivary gland cells that secrete digestive enzymes or immune system cells that secrete antibodies) have an abundance of Golgi. In plant cells, the Golgi apparatus has the additional role of synthesizing polysaccharides, some of which are incorporated into the cell wall and some of which other cell parts use.
Lysosomes
Lysosomes are part of the endomembrane system. Lysosomes are found in animal cells. They contain hydrolytic enzymes that are used to digest macromolecules and worn-out organelles.
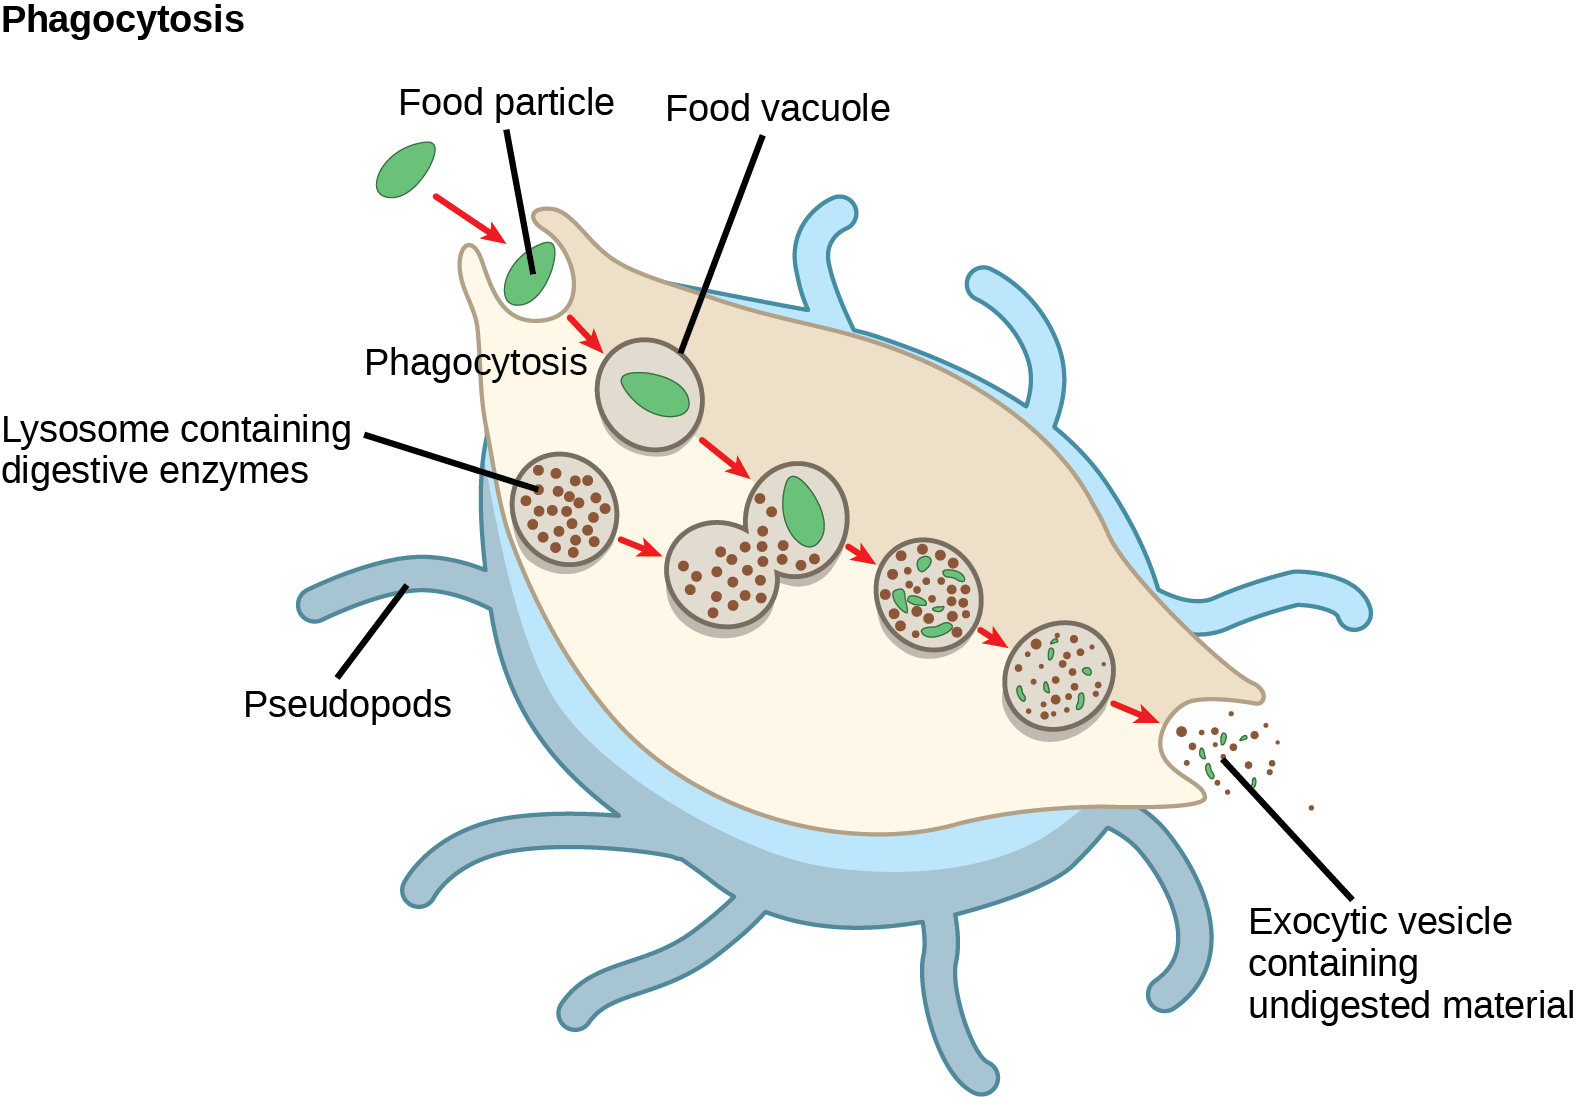
Lysosomes also use their hydrolytic enzymes to destroy pathogens (disease-causing organisms) that might enter the cell. A good example of this occurs in macrophages, a group of white blood cells which are part of your body’s immune system. In a process that scientists call phagocytosis or endocytosis, a section of the macrophage’s plasma membrane invaginates (folds in) and engulfs a pathogen. The invaginated section, with the pathogen inside, then pinches itself off from the plasma membrane and becomes a vesicle. The vesicle fuses with a lysosome. The lysosome’s hydrolytic enzymes then destroy the pathogen.

Media Attributions
- Endomembrane System © Melissa Hardy is licensed under a CC BY-NC (Attribution NonCommercial) license
- Human leukocyte showing golgi © Louisa Howard is licensed under a Public Domain license
- Golgi protein © OpenStax is licensed under a CC BY (Attribution) license
- lysosome © OpenStax is licensed under a CC BY (Attribution) license
[latexpage]
Learning Objectives
By the end of this section, you will be able to:
- Compare homologous and analogous traits
- Discuss the purpose of cladistics
- Describe maximum parsimony
Scientists must collect accurate information that allows them to make evolutionary connections among organisms. Similar to detective work, scientists must use evidence to uncover the facts. In the case of phylogeny, evolutionary investigations focus on two types of evidence: morphologic (form and function) and genetic.
Two Options for Similarities
In general, organisms that share similar physical features and genomes tend to be more closely related than those that do not. Such features that overlap both morphologically (in form) and genetically are referred to as homologous structures; they stem from developmental similarities that are based on evolution. For example, the bones in the wings of bats and birds have homologous structures ([link]).
Notice it is not simply a single bone, but rather a grouping of several bones arranged in a similar way. The more complex the feature, the more likely any kind of overlap is due to a common evolutionary past. Imagine two people from different countries both inventing a car with all the same parts and in exactly the same arrangement without any previous or shared knowledge. That outcome would be highly improbable. However, if two people both invented a hammer, it would be reasonable to conclude that both could have the original idea without the help of the other. The same relationship between complexity and shared evolutionary history is true for homologous structures in organisms.
Misleading Appearances
Some organisms may be very closely related, even though a minor genetic change caused a major morphological difference to make them look quite different. Similarly, unrelated organisms may be distantly related, but appear very much alike. This usually happens because both organisms were in common adaptations that evolved within similar environmental conditions. When similar characteristics occur because of environmental constraints and not due to a close evolutionary relationship, it is called an analogy or homoplasy. For example, insects use wings to fly like bats and birds, but the wing structure and embryonic origin is completely different. These are called analogous structures ([link]).
Similar traits can be either homologous or analogous. Homologous structures share a similar embryonic origin; analogous organs have a similar function. For example, the bones in the front flipper of a whale are homologous to the bones in the human arm. These structures are not analogous. The wings of a butterfly and the wings of a bird are analogous but not homologous. Some structures are both analogous and homologous: the wings of a bird and the wings of a bat are both homologous and analogous. Scientists must determine which type of similarity a feature exhibits to decipher the phylogeny of the organisms being studied.
This website has several examples to show how appearances can be misleading in understanding the phylogenetic relationships of organisms.
Molecular Comparisons
With the advancement of DNA technology, the area of molecular systematics, which describes the use of information on the molecular level including DNA analysis, has blossomed. New computer programs not only confirm many earlier classified organisms, but also uncover previously made errors. As with physical characteristics, even the DNA sequence can be tricky to read in some cases. For some situations, two very closely related organisms can appear unrelated if a mutation occurred that caused a shift in the genetic code. An insertion or deletion mutation would move each nucleotide base over one place, causing two similar codes to appear unrelated.
Sometimes two segments of DNA code in distantly related organisms randomly share a high percentage of bases in the same locations, causing these organisms to appear closely related when they are not. For both of these situations, computer technologies have been developed to help identify the actual relationships, and, ultimately, the coupled use of both morphologic and molecular information is more effective in determining phylogeny.
Why Does Phylogeny Matter?Evolutionary biologists could list many reasons why understanding phylogeny is important to everyday life in human society. For botanists, phylogeny acts as a guide to discovering new plants that can be used to benefit people. Think of all the ways humans use plants—food, medicine, and clothing are a few examples. If a plant contains a compound that is effective in treating cancer, scientists might want to examine all of the relatives of that plant for other useful drugs.
A research team in China identified a segment of DNA thought to be common to some medicinal plants in the family Fabaceae (the legume family) and worked to identify which species had this segment ([link]). After testing plant species in this family, the team found a DNA marker (a known location on a chromosome that enabled them to identify the species) present. Then, using the DNA to uncover phylogenetic relationships, the team could identify whether a newly discovered plant was in this family and assess its potential medicinal properties.
Building Phylogenetic Trees
How do scientists construct phylogenetic trees? After the homologous and analogous traits are sorted, scientists often organize the homologous traits using a system called cladistics. This system sorts organisms into clades: groups of organisms that descended from a single ancestor. For example, in [link], all of the organisms in the orange region evolved from a single ancestor that had amniotic eggs. Consequently, all of these organisms also have amniotic eggs and make a single clade, also called a monophyletic group. Clades must include all of the descendants from a branch point.
Which animals in this figure belong to a clade that includes animals with hair? Which evolved first, hair or the amniotic egg?
<!--<para> Rabbits and humans belong in the clade that includes animals with hair. The amniotic egg evolved before hair because the Amniota clade is larger than the clade that encompasses animals with hair.-->
Clades can vary in size depending on which branch point is being referenced. The important factor is that all of the organisms in the clade or monophyletic group stem from a single point on the tree. This can be remembered because monophyletic breaks down into “mono,” meaning one, and “phyletic,” meaning evolutionary relationship. [link] shows various examples of clades. Notice how each clade comes from a single point, whereas the non-clade groups show branches that do not share a single point.
What is the largest clade in this diagram?
<!--<para> The largest clade encompasses the entire tree.-->
Shared Characteristics
Organisms evolve from common ancestors and then diversify. Scientists use the phrase “descent with modification” because even though related organisms have many of the same characteristics and genetic codes, changes occur. This pattern repeats over and over as one goes through the phylogenetic tree of life:
- A change in the genetic makeup of an organism leads to a new trait which becomes prevalent in the group.
- Many organisms descend from this point and have this trait.
- New variations continue to arise: some are adaptive and persist, leading to new traits.
- With new traits, a new branch point is determined (go back to step 1 and repeat).
If a characteristic is found in the ancestor of a group, it is considered a shared ancestral character because all of the organisms in the taxon or clade have that trait. The vertebrate in [link] is a shared ancestral character. Now consider the amniotic egg characteristic in the same figure. Only some of the organisms in [link] have this trait, and to those that do, it is called a shared derived character because this trait derived at some point but does not include all of the ancestors in the tree.
The tricky aspect to shared ancestral and shared derived characters is the fact that these terms are relative. The same trait can be considered one or the other depending on the particular diagram being used. Returning to [link], note that the amniotic egg is a shared ancestral character for the Amniota clade, while having hair is a shared derived character for some organisms in this group. These terms help scientists distinguish between clades in the building of phylogenetic trees.
Choosing the Right Relationships
Imagine being the person responsible for organizing all of the items in a department store properly—an overwhelming task. Organizing the evolutionary relationships of all life on Earth proves much more difficult: scientists must span enormous blocks of time and work with information from long-extinct organisms. Trying to decipher the proper connections, especially given the presence of homologies and analogies, makes the task of building an accurate tree of life extraordinarily difficult. Add to that the advancement of DNA technology, which now provides large quantities of genetic sequences to be used and analyzed. Taxonomy is a subjective discipline: many organisms have more than one connection to each other, so each taxonomist will decide the order of connections.
To aid in the tremendous task of describing phylogenies accurately, scientists often use a concept called maximum parsimony, which means that events occurred in the simplest, most obvious way. For example, if a group of people entered a forest preserve to go hiking, based on the principle of maximum parsimony, one could predict that most of the people would hike on established trails rather than forge new ones.
For scientists deciphering evolutionary pathways, the same idea is used: the pathway of evolution probably includes the fewest major events that coincide with the evidence at hand. Starting with all of the homologous traits in a group of organisms, scientists look for the most obvious and simple order of evolutionary events that led to the occurrence of those traits.
Head to this website to learn how maximum parsimony is used to create phylogenetic trees.
These tools and concepts are only a few of the strategies scientists use to tackle the task of revealing the evolutionary history of life on Earth. Recently, newer technologies have uncovered surprising discoveries with unexpected relationships, such as the fact that people seem to be more closely related to fungi than fungi are to plants. Sound unbelievable? As the information about DNA sequences grows, scientists will become closer to mapping the evolutionary history of all life on Earth.
Section Summary
To build phylogenetic trees, scientists must collect accurate information that allows them to make evolutionary connections between organisms. Using morphologic and molecular data, scientists work to identify homologous characteristics and genes. Similarities between organisms can stem either from shared evolutionary history (homologies) or from separate evolutionary paths (analogies). Newer technologies can be used to help distinguish homologies from analogies. After homologous information is identified, scientists use cladistics to organize these events as a means to determine an evolutionary timeline. Scientists apply the concept of maximum parsimony, which states that the order of events probably occurred in the most obvious and simple way with the least amount of steps. For evolutionary events, this would be the path with the least number of major divergences that correlate with the evidence.
Art Connections
[link] Which animals in this figure belong to a clade that includes animals with hair? Which evolved first, hair or the amniotic egg?
[link] Rabbits and humans belong in the clade that includes animals with hair. The amniotic egg evolved before hair because the Amniota clade is larger than the clade that encompasses animals with hair.
Review Questions
Which statement about analogies is correct?
- They occur only as errors.
- They are synonymous with homologous traits.
- They are derived by similar environmental constraints.
- They are a form of mutation.
C
What do scientists use to apply cladistics?
- homologous traits
- homoplasies
- analogous traits
- monophyletic groups
A
What is true about organisms that are a part of the same clade?
- They all share the same basic characteristics.
- They evolved from a shared ancestor.
- They usually fall into the same classification taxa.
- They have identical phylogenies.
B
Why do scientists apply the concept of maximum parsimony?
- to decipher accurate phylogenies
- to eliminate analogous traits
- to identify mutations in DNA codes
- to locate homoplasies
A
Free Response
Dolphins and fish have similar body shapes. Is this feature more likely a homologous or analogous trait?
Dolphins are mammals and fish are not, which means that their evolutionary paths (phylogenies) are quite separate. Dolphins probably adapted to have a similar body plan after returning to an aquatic lifestyle, and, therefore, this trait is probably analogous.
Why is it so important for scientists to distinguish between homologous and analogous characteristics before building phylogenetic trees?
Phylogenetic trees are based on evolutionary connections. If an analogous similarity were used on a tree, this would be erroneous and, furthermore, would cause the subsequent branches to be inaccurate.
Describe maximum parsimony.
Maximum parsimony hypothesizes that events occurred in the simplest, most obvious way, and the pathway of evolution probably includes the fewest major events that coincide with the evidence at hand.
Glossary
- analogy
- (also, homoplasy) characteristic that is similar between organisms by convergent evolution, not due to the same evolutionary path
- cladistics
- system used to organize homologous traits to describe phylogenies
- maximum parsimony
- applying the simplest, most obvious way with the least number of steps
- molecular systematics
- technique using molecular evidence to identify phylogenetic relationships
- monophyletic group
- (also, clade) organisms that share a single ancestor
- shared ancestral character
- describes a characteristic on a phylogenetic tree that is shared by all organisms on the tree
- shared derived character
- describes a characteristic on a phylogenetic tree that is shared only by a certain clade of organisms
[latexpage]
Learning Objectives
By the end of this section, you will be able to:
- Define population genetics and describe how population genetics is used in the study of the evolution of populations
- Define the Hardy-Weinberg principle and discuss its importance
The mechanisms of inheritance, or genetics, were not understood at the time Charles Darwin and Alfred Russel Wallace were developing their idea of natural selection. This lack of understanding was a stumbling block to understanding many aspects of evolution. In fact, the predominant (and incorrect) genetic theory of the time, blending inheritance, made it difficult to understand how natural selection might operate. Darwin and Wallace were unaware of the genetics work by Austrian monk Gregor Mendel, which was published in 1866, not long after publication of Darwin's book, On the Origin of Species. Mendel’s work was rediscovered in the early twentieth century at which time geneticists were rapidly coming to an understanding of the basics of inheritance. Initially, the newly discovered particulate nature of genes made it difficult for biologists to understand how gradual evolution could occur. But over the next few decades genetics and evolution were integrated in what became known as the modern synthesis—the coherent understanding of the relationship between natural selection and genetics that took shape by the 1940s and is generally accepted today. In sum, the modern synthesis describes how evolutionary processes, such as natural selection, can affect a population’s genetic makeup, and, in turn, how this can result in the gradual evolution of populations and species. The theory also connects this change of a population over time, called microevolution, with the processes that gave rise to new species and higher taxonomic groups with widely divergent characters, called macroevolution.
Evolution and Flu VaccinesEvery fall, the media starts reporting on flu vaccinations and potential outbreaks. Scientists, health experts, and institutions determine recommendations for different parts of the population, predict optimal production and inoculation schedules, create vaccines, and set up clinics to provide inoculations. You may think of the annual flu shot as a lot of media hype, an important health protection, or just a briefly uncomfortable prick in your arm. But do you think of it in terms of evolution?
The media hype of annual flu shots is scientifically grounded in our understanding of evolution. Each year, scientists across the globe strive to predict the flu strains that they anticipate being most widespread and harmful in the coming year. This knowledge is based in how flu strains have evolved over time and over the past few flu seasons. Scientists then work to create the most effective vaccine to combat those selected strains. Hundreds of millions of doses are produced in a short period in order to provide vaccinations to key populations at the optimal time.
Because viruses, like the flu, evolve very quickly (especially in evolutionary time), this poses quite a challenge. Viruses mutate and replicate at a fast rate, so the vaccine developed to protect against last year’s flu strain may not provide the protection needed against the coming year’s strain. Evolution of these viruses means continued adaptions to ensure survival, including adaptations to survive previous vaccines.
Population Genetics
Recall that a gene for a particular character may have several alleles, or variants, that code for different traits associated with that character. For example, in the ABO blood type system in humans, three alleles determine the particular blood-type protein on the surface of red blood cells. Each individual in a population of diploid organisms can only carry two alleles for a particular gene, but more than two may be present in the individuals that make up the population. Mendel followed alleles as they were inherited from parent to offspring. In the early twentieth century, biologists in a field of study known as population genetics began to study how selective forces change a population through changes in allele and genotypic frequencies.
The allele frequency (or gene frequency) is the rate at which a specific allele appears within a population. Until now we have discussed evolution as a change in the characteristics of a population of organisms, but behind that phenotypic change is genetic change. In population genetics, the term evolution is defined as a change in the frequency of an allele in a population. Using the ABO blood type system as an example, the frequency of one of the alleles, IA, is the number of copies of that allele divided by all the copies of the ABO gene in the population. For example, a study in Jordan1 found a frequency of IA to be 26.1 percent. The IB and I0 alleles made up 13.4 percent and 60.5 percent of the alleles respectively, and all of the frequencies added up to 100 percent. A change in this frequency over time would constitute evolution in the population.
The allele frequency within a given population can change depending on environmental factors; therefore, certain alleles become more widespread than others during the process of natural selection. Natural selection can alter the population’s genetic makeup; for example, if a given allele confers a phenotype that allows an individual to better survive or have more offspring. Because many of those offspring will also carry the beneficial allele, and often the corresponding phenotype, they will have more offspring of their own that also carry the allele, thus, perpetuating the cycle. Over time, the allele will spread throughout the population. Some alleles will quickly become fixed in this way, meaning that every individual of the population will carry the allele, while detrimental mutations may be swiftly eliminated if derived from a dominant allele from the gene pool. The gene pool is the sum of all the alleles in a population.
Sometimes, allele frequencies within a population change randomly with no advantage to the population over existing allele frequencies. This phenomenon is called genetic drift. Natural selection and genetic drift usually occur simultaneously in populations and are not isolated events. It is hard to determine which process dominates because it is often nearly impossible to determine the cause of change in allele frequencies at each occurrence. An event that initiates an allele frequency change in an isolated part of the population, which is not typical of the original population, is called the founder effect. Natural selection, random drift, and founder effects can lead to significant changes in the genome of a population.
Hardy-Weinberg Principle of Equilibrium
In the early twentiethcentury, English mathematician Godfrey Hardy and German physician Wilhelm Weinberg stated the principle of equilibrium to describe the genetic makeup of a population. The theory, which later became known as the Hardy-Weinberg principle of equilibrium, states that a population’s allele and genotype frequencies are inherently stable— unless some kind of evolutionary force is acting upon the population, neither the allele nor the genotypic frequencies would change. The Hardy-Weinberg principle assumes conditions with no mutations, migration, emigration, or selective pressure for or against genotype, plus an infinite population; while no population can satisfy those conditions, the principle offers a useful model against which to compare real population changes.
Working under this theory, population geneticists represent different alleles as different variables in their mathematical models. The variable p, for example, often represents the frequency of a particular allele, say Y for the trait of yellow in Mendel’s peas, while the variable q represents the frequency of y alleles that confer the color green. If these are the only two possible alleles for a given locus in the population, p + q = 1. In other words, all the p alleles and all the q alleles make up all of the alleles for that locus that are found in the population.
But what ultimately interests most biologists is not the frequencies of different alleles, but the frequencies of the resulting genotypes, known as the population’s genetic structure, from which scientists can surmise the distribution of phenotypes. If the phenotype is observed, only the genotype of the homozygous recessive alleles can be known; the calculations provide an estimate of the remaining genotypes. Since each individual carries two alleles per gene, if the allele frequencies (p and q) are known, predicting the frequencies of these genotypes is a simple mathematical calculation to determine the probability of getting these genotypes if two alleles are drawn at random from the gene pool. So in the above scenario, an individual pea plant could be pp (YY), and thus produce yellow peas; pq (Yy), also yellow; or qq (yy), and thus producing green peas ([link]). In other words, the frequency of pp individuals is simply p2; the frequency of pq individuals is 2pq; and the frequency of qq individuals is q2. And, again, if p and q are the only two possible alleles for a given trait in the population, these genotypes frequencies will sum to one: p2 + 2pq + q2 = 1.
In plants, violet flower color (V) is dominant over white (v). If p = 0.8 and q = 0.2 in a population of 500 plants, how many individuals would you expect to be homozygous dominant (VV), heterozygous (Vv), and homozygous recessive (vv)? How many plants would you expect to have violet flowers, and how many would have white flowers?
<!--<para>The expected distribution is 320 VV, 160Vv, and 20 vv plants. Plants with VV or Vv genotypes would have violet flowers, and plants with the vv genotype would have white flowers, so a total of 480 plants would be expected to have violet flowers, and 20 plants would have white flowers.-->
In theory, if a population is at equilibrium—that is, there are no evolutionary forces acting upon it—generation after generation would have the same gene pool and genetic structure, and these equations would all hold true all of the time. Of course, even Hardy and Weinberg recognized that no natural population is immune to evolution. Populations in nature are constantly changing in genetic makeup due to drift, mutation, possibly migration, and selection. As a result, the only way to determine the exact distribution of phenotypes in a population is to go out and count them. But the Hardy-Weinberg principle gives scientists a mathematical baseline of a non-evolving population to which they can compare evolving populations and thereby infer what evolutionary forces might be at play. If the frequencies of alleles or genotypes deviate from the value expected from the Hardy-Weinberg equation, then the population is evolving.
Section Summary
The modern synthesis of evolutionary theory grew out of the cohesion of Darwin’s, Wallace’s, and Mendel’s thoughts on evolution and heredity, along with the more modern study of population genetics. It describes the evolution of populations and species, from small-scale changes among individuals to large-scale changes over paleontological time periods. To understand how organisms evolve, scientists can track populations’ allele frequencies over time. If they differ from generation to generation, scientists can conclude that the population is not in Hardy-Weinberg equilibrium, and is thus evolving.
Art Connections
[link] In plants, violet flower color (V) is dominant over white (v). If p=.8 and q = 0.2 in a population of 500 plants, how many individuals would you expect to be homozygous dominant (VV), heterozygous (Vv), and homozygous recessive (vv)? How many plants would you expect to have violet flowers, and how many would have white flowers?
[link] The expected distribution is 320 VV, 160Vv, and 20 vv plants. Plants with VV or Vv genotypes would have violet flowers, and plants with the vv genotype would have white flowers, so a total of 480 plants would be expected to have violet flowers, and 20 plants would have white flowers.
Review Questions
What is the difference between micro- and macroevolution?
- Microevolution describes the evolution of small organisms, such as insects, while macroevolution describes the evolution of large organisms, like people and elephants.
- Microevolution describes the evolution of microscopic entities, such as molecules and proteins, while macroevolution describes the evolution of whole organisms.
- Microevolution describes the evolution of organisms in populations, while macroevolution describes the evolution of species over long periods of time.
- Microevolution describes the evolution of organisms over their lifetimes, while macroevolution describes the evolution of organisms over multiple generations.
C
Population genetics is the study of:
- how selective forces change the allele frequencies in a population over time
- the genetic basis of population-wide traits
- whether traits have a genetic basis
- the degree of inbreeding in a population
A
Which of the following populations is not in Hardy-Weinberg equilibrium?
- a population with 12 homozygous recessive individuals (yy), 8 homozygous dominant individuals (YY), and 4 heterozygous individuals (Yy)
- a population in which the allele frequencies do not change over time
- p2 + 2pq + q2 = 1
- a population undergoing natural selection
D
One of the original Amish colonies rose from a ship of colonists that came from Europe. The ship’s captain, who had polydactyly, a rare dominant trait, was one of the original colonists. Today, we see a much higher frequency of polydactyly in the Amish population. This is an example of:
- natural selection
- genetic drift
- founder effect
- b and c
D
Free Response
Solve for the genetic structure of a population with 12 homozygous recessive individuals (yy), 8 homozygous dominant individuals (YY), and 4 heterozygous individuals (Yy).
p = (8*2 + 4)/48 = .42; q = (12*2 + 4)/48 = .58; p2 = .17; 2pq = .48; q2 = .34
Explain the Hardy-Weinberg principle of equilibrium theory.
The Hardy-Weinberg principle of equilibrium is used to describe the genetic makeup of a population. The theory states that a population’s allele and genotype frequencies are inherently stable: unless some kind of evolutionary force is acting upon the population, generation after generation of the population would carry the same genes, and individuals would, as a whole, look essentially the same.
Imagine you are trying to test whether a population of flowers is undergoing evolution. You suspect there is selection pressure on the color of the flower: bees seem to cluster around the red flowers more often than the blue flowers. In a separate experiment, you discover blue flower color is dominant to red flower color. In a field, you count 600 blue flowers and 200 red flowers. What would you expect the genetic structure of the flowers to be?
Red is recessive so q2 = 200/800 = 0.25; q = 0.5; p = 1-q = 0.5; p2 = 0.25; 2pq = 0.5. You would expect 200 homozygous blue flowers, 400 heterozygous blue flowers, and 200 red flowers.
Footnotes
- 1 Sahar S. Hanania, Dhia S. Hassawi, and Nidal M. Irshaid, “Allele Frequency and Molecular Genotypes of ABO Blood Group System in a Jordanian Population,” Journal of Medical Sciences 7 (2007): 51-58, doi:10.3923/jms.2007.51.58.
Glossary
- allele frequency
- (also, gene frequency) rate at which a specific allele appears within a population
- founder effect
- event that initiates an allele frequency change in part of the population, which is not typical of the original population
- gene pool
- all of the alleles carried by all of the individuals in the population
- genetic structure
- distribution of the different possible genotypes in a population
- macroevolution
- broader scale evolutionary changes seen over paleontological time
- microevolution
- changes in a population’s genetic structure
- modern synthesis
- overarching evolutionary paradigm that took shape by the 1940s and is generally accepted today
- population genetics
- study of how selective forces change the allele frequencies in a population over time