11.3 Thermoregulation
Malia Hoey and Christelle Sabatier
Learning Objectives
By the end of this section, you will be able to do the following:
- Differentiate between endotherms, ectotherms, poikilotherms, and homeotherms.
- Interpret graphical representations of physiological data, such as body temperature and metabolic rate, as functions of ambient temperature.
Endotherms and Ectotherms
Animals are classified as endotherms or ectotherms based on how they primarily obtain heat. Endotherms (e.g., mammals and birds) are animals that rely on internal metabolic processes to generate most of their body heat. This allows them to maintain a relatively high level of metabolic activity even at cooler environmental temperatures, which an ectotherm cannot due to differing enzyme levels of activity. In contrast, ectotherms (e.g., reptiles, amphibians, fish, invertebrates) are animals that rely on external temperatures to set their body temperature. While this group has historically been called “cold-blooded,” the term can be misleading as an ectotherm in a hot environment, such as a desert lizard basking in the sun, can achieve a very warm body temperature.
Animals are also classified based on the constancy of their internal temperature as homeotherms or poikilotherms. A homeotherm is an animal that maintains a relatively constant body temperature in the face of environmental changes. Conversely, a poikilotherm is an animal whose internal body temperature fluctuates naturally and varies with the surrounding environmental conditions. For example, a fish in a cold lake will have a lower body temperature, while the same fish in a warmer environment will have a higher body temperature. Poikilotherms generally do not actively regulate their internal heat to keep it constant, and thus their metabolic processes are directly influenced by the environmental temperature.
It is crucial to understand that these two classification systems (by heat source and by temperature stability) are distinct and independent. An animal’s primary heat source does not always dictate the stability of its internal temperature. Most endotherms are homeotherms (e.g., humans, penguins), consistently maintaining a high, stable body temperature through internal heat generation. Most ectotherms are poikilotherms (e.g., most fish and reptiles), with their body temperature fluctuating alongside the environment.
However, there are important exceptions. Some ectotherms live in environments with very constant temperatures (e.g., deep-sea fish) and thus maintain a relatively constant body temperature, making them ectothermic homeotherms. Conversely, some animals may fluctuate between periods when they allow their body temperature to fluctuate based on environmental temperatures while during other periods, they maintain relatively constant body temperature. These animals, such as those who undergo hibernation or torpor, are considered heterotherms and exhibit partial poikilothermic and homeothermic capabilities.
Physiological Responses to Ambient Temperature
Understanding the distinctions between endotherms, ectotherms, homeotherms, and poikilotherms is crucial for comprehending how animals manage their body heat. These different thermoregulatory strategies are reflected in the characteristic relationships between an animal’s body temperature (Tb) or metabolic rate (MR) and the ambient (environmental) temperature (Ta). For instance, an endotherm must adjust its metabolic heat production to maintain a stable body temperature across varying ambient temperatures, while an ectotherm’s body temperature will largely track the ambient temperature.
Measuring an animal’s metabolic rate across an range of ambient temperatures provides insight into how it thermoregulates. For ectotherms, which rely mainly on external heat sources, body temperature and metabolic rate fluctuate directly based on changes in ambient temperature. In contrast, endotherms maintain a relatively stable body temperature by increasing their internal heat production, especially at colder temperatures. With increased metabolic demand at low temperatures, this allows them to stay active and functional in cooler environments. However, this comes at a significant energetic cost.
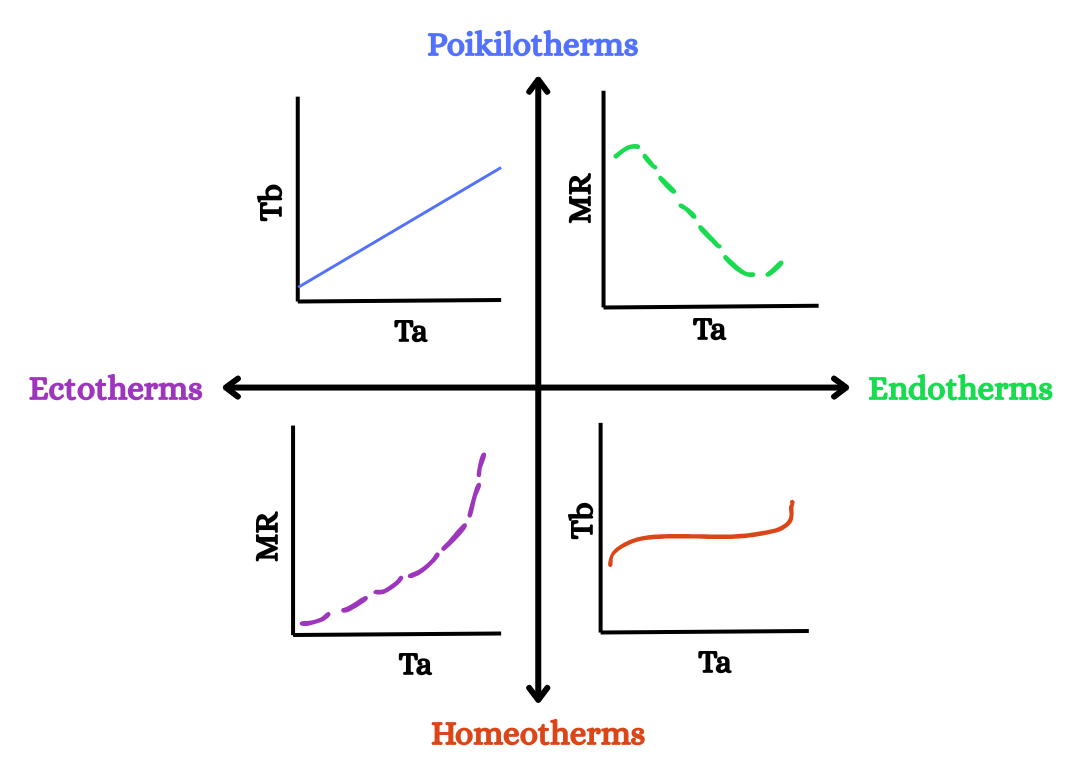
Figure 11.3.2 depicts how these physiological patterns help distinguish where an animal lies on the thermoregulatory continuum, from fully endothermic to highly endothermic. One significant feature in endotherms is the thermoneutral zone, a range of ambient temperatures where the metabolic rate remains minimal and relatively constant, as the animal is not required to expend extra energy to maintain body temperature. Beyond this zone, either heat loss or heat gain becomes a challenge, triggering energy-intensive cooling mechanisms like panting or sweating at high ambient temperatures, and metabolic heat production at low ambient temperatures. In contrast, poikilotherms (whose body temperature varies widely) experience minimal control over their internal temperatures, with their body temperature rising and falling in close parallel with the environment, limiting their activity in cold conditions but allowing high activity in warmer climates.
Practice Questions
Glossary
ectotherms
animals that rely on external temperatures to regulate their body temperature
endotherms
animals that rely on internal metabolic processes to regulate their body temperature
homeotherms
animals that maintain a relatively constant body temperature
heterotherms
animals that vary between self-regulating their body temperature, and allowing the surrounding environment to affect it
poikilotherms
animals whose internal body temperature fluctuates naturally with environmental temperature
Figure Descriptions
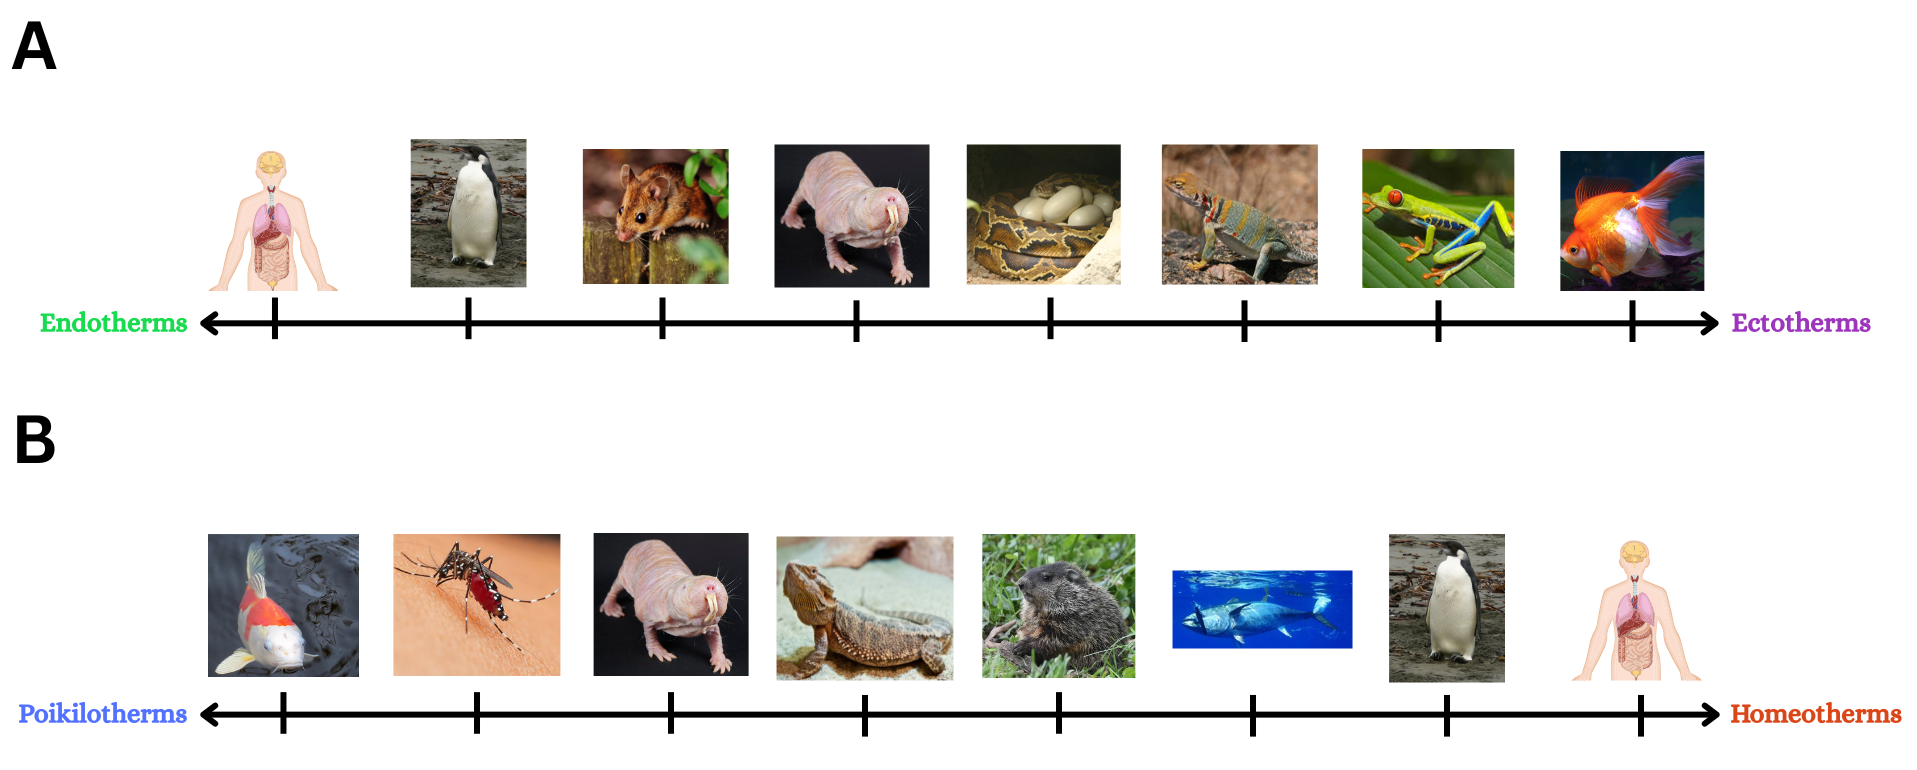
Figure 11.3.1. The image consists of two labeled rows titled “A” and “B,” each illustrating a spectrum. Row A has a horizontal line with arrows at both ends. The left arrow is labeled “Endotherms” in green, and the right arrow is labeled “Ectotherms” in purple. Images along the line from left to right include: a human torso diagram, a penguin, a mouse or rodent, a naked mole-rat, a snake with an egg, a lizard, a tree frog, and a goldfish. Row B also has a horizontal line with arrows at both ends. The left arrow is labeled “Poikilotherms” in blue, and the right arrow is labeled “Homeotherms” in orange. Images along the line from left to right include: a koi fish, a mosquito on skin, a naked mole-rat, a lizard, a groundhog or similar rodent, a dolphin or whale, a penguin, and a human torso diagram. [Return to Figure 11.3.1]
Figure 11.3.2. The image features a quadrant graph with two axes and four graphs in each quadrant. The horizontal axis represents ambient temperature (Ta), while the vertical axis alternates between body temperature (Tb) and metabolic rate (MR), depending on the quadrant. In the top-left quadrant labeled “Poikilotherms,” Tb is plotted against Ta with a straight blue line indicating a direct correlation. The top-right quadrant, labeled “Endotherms,” shows MR against Ta with a green dashed line indicating a decreasing trend. The bottom-left quadrant represents ectotherms with MR against Ta, manifesting a purple dashed line showing an increasing trend as temperature rises. The bottom-right quadrant labeled “Homeotherms,” plots Tb against Ta with an orange line showing that Tb remains relatively stable across varying temperatures. [Return to Figure 11.3.2]
Licenses and Attributions
“11.3 Thermoregulation” is adapted from “33.3 Homeostasis” by Mary Ann Clark, Matthew Douglas, and Jung Choi for OpenStax Biology 2e under CC-BY 4.0. “11.3 Thermoregulation” is licensed under CC-BY-NC 4.0.
Media Attributions
- 1A.B-Scale-Endotherms-Ectotherms-Poikilotherms-Homeotherms is licensed under a CC BY-NC (Attribution NonCommercial) license
- 1A.B-Metabolic-Rate-Endo-Ecto-Poikilo-Homeo is licensed under a CC BY-NC (Attribution NonCommercial) license
animals that rely on internal metabolic processes to regulate their body temperature
animals that rely on external temperatures to regulate their body temperature
Animals that maintain a relatively constant body temperature
animals whose internal body temperature fluctuates naturally with environmental temperature
animals that vary between self-regulating their body temperature, and allowing the surrounding environment to affect it.
