Chapter 14 Acid Base Equilibria
14.8 Acid-Base Titrations
Learning Objectives
By the end of this section, you will be able to:
- Interpret titration curves for strong and weak acid-base systems
- Compute sample pH at important stages of a titration
- Explain the function of acid-base indicators
As discussed in Section 4.4, titrations can be used to quantitatively analyze solutions for their acid or base concentrations. In this section, we will explore the underlying chemical equilibria that make acid-base titrimetry a useful analytical technique.
Titration Curves
A titration curve is a plot of some solution property versus the amount of added titrant (see Section 4.4 to review titration vocabulary). For acid-base titrations, solution pH is a useful property to monitor because it varies predictably with the solution composition and, therefore, may be used to monitor the titration’s progress and detect its end point. The following example exercise demonstrates the computation of pH for a titration solution after additions of several specified titrant volumes. The first example involves a strong acid titration that requires only stoichiometric calculations to derive the solution pH. The second example addresses a weak acid titration requiring equilibrium calculations.
Example 14.22 - Calculating pH for Titration Solutions: Strong Acid/Strong Base
A titration is carried out for 25.00 mL of 0.100 M HCl (strong acid) with 0.100 M of a strong base NaOH (the titration curve is shown in Figure 14.21). Calculate the pH at these volumes of added base solution:
(a) 0.00 mL
(b) 12.50 mL
(c) 25.00 mL
(d) 37.50 mL
Solution
(a) Titrant volume = 0 mL.
The solution pH is due to the acid ionization of HCl. Because this is a strong acid, the ionization is complete and the hydronium ion molarity is 0.100 M. The pH of the solution is then:
(b) Titrant volume = 12.50 mL.
First we calculate the moles (n) of acid and base being combined:
| H+(aq) | + | OH−(aq) | → | H2O(l) | |
| I (mol) | 2.50 × 10⁻³ | 1.25 × 10⁻³ | -- | ||
| C (mol) | −1.25 × 10⁻³ | −1.25 × 10⁻³ | (+1.25 × 10⁻³) | ||
| F (mol) | 1.25 × 10⁻³ | 0 | -- |
The pH can be found from the concentration of acid remaining:
(c) Titrant volume = 25.00 mL.
First we calculate the moles of base being added:
| H+(aq) | + | OH−(aq) | → | H2O(l) | |
| I (mol) | 2.50 × 10⁻³ | 2.50 × 10⁻³ | -- | ||
| C (mol) | −2.50 × 10⁻³ | −2.50 × 10⁻³ | (+1.25 × 10⁻³) | ||
| F (mol) | 0 | 0 | -- |
This titrant addition involves a stoichiometric amount of base (the equivalence point), and so only products of the neutralization reaction are in solution (water and NaCl). Neither the cation nor the anion of this salt undergo acid-base ionization; the only process generating hydronium ions is the autoprotolysis of water. The solution is neutral, having a pH = 7.00.
(d) Titrant volume = 37.50 mL.
| H+(aq) | + | OH−(aq) | → | H2O(l) | |
| I (mol) | 2.50 × 10⁻³ | 3.75 × 10⁻³ | -- | ||
| C (mol) | −2.50 × 10⁻³ | −2.50 × 10⁻³ | (+2.50 × 10⁻³) | ||
| F (mol) | 0 | 1.25 × 10⁻³ | -- |
The solution pH is then calculated using the concentration of hydroxide ion:
[latex][OH^-] = \frac {n(OH^-)}{V_{total}} = \frac {1.25 \times 10^{-3} \: mol}{(25.00 \: mL + 37.50 \: mL) \: \frac {1 \: L}{1000 \: mL}} = 0.200 \: M[/latex]
[latex]\text {pOH} = - \log [OH^-] = - \log {(0.200)} = 1.70[/latex]
[latex]\text {pH} = 14.00 - \log {pOH} = 14.00 - 1.70 = 12.30[/latex]
Check Your Learning
Click here to see the answers and a walkthrough for each problem!
Question 1
Because nitric acid (HNO3) is a strong acid, it dissociates fully. We can therefore straightforwardly calculate the pH using its concentration:
[latex]pH\ =\ -\log\left(0.100\right)=1.00[/latex]
Question 2
First we calculate the moles (n) of acid and base being combined:
Example 14.23 - Titration of a Weak Acid with a Strong Base
Consider the titration of 25.00 mL of 0.100 M CH3CO2H with 0.100 M NaOH. The reaction can be represented as:
Calculate the pH of the titration solution after the addition of the following volumes of NaOH titrant:
(a) 0.00 mL
(b) 25.00 mL
(c) 12.50 mL
(d) 37.50 mL
Solution
(a) Titrant volume = 0 mL.
The initial pH is computed for the acetic acid solution in the usual ICE approach:
| CH3CO2H(aq) | + | H2O(l) | ⇌ | H3O+(aq) | + | CH3CO2−(aq) | |
| I (M) | 0.100 | -- | ~0 | 0 | |||
| C (M) | −x | (−x) | +x | +x | |||
| E (M) | 0.100 − x | -- | x | x |
(b) Titrant volume = 25.00 mL
[latex]n_{CH_3CO_2H} = 25.00 \cancel mL \: \left( \frac {1 \cancel L}{1000 \cancel {mL}} \right) \: \left( \frac {0.100 \: mol}{\cancel L} \right) = 2.50 \times 10^{-3} \: mol[/latex]
[latex]n_{OH^-} = 25.00 \cancel {mL} \: \left( \frac {1 \cancel L}{1000 \cancel {mL}} \right) \: \left( \frac {0.100 \: mol}{\cancel L} \right) = 2.50 \times 10^{-3} \: mol[/latex]
| CH3CO2H(aq) | + | OH−(aq) | → | H2O(l) | + | CH3CO2−(aq) | |
| I (mol) | 2.50 × 10⁻³ | 2.50 × 10⁻³ | -- | 0 | |||
| C (mol) | −2.50 × 10⁻³ | −2.50 × 10⁻³ | +2.50 × 10⁻³ | +2.50 × 10⁻³ | |||
| F (mol) | 0 | 0 | -- | 2.50 × 10⁻³ |
The acid and titrant are both monoprotic and the sample and titrant solutions are equally concentrated; thus, this volume of titrant represents the equivalence point. Unlike the strong-acid example above, however, the reaction mixture in this case contains a weak conjugate base (acetate ion). The solution pH is computed considering the base ionization of acetate, which is present at a concentration of:
[latex][CH_3CO_2^-] = \frac {n}{V} = \frac {2.50 \times 10^{-3} \: mol}{(25.00 + 25.00) \: mL \: \left( \frac {1 \: L}{1000 \: mL} \right) } = 0.0500 \: M[/latex]
Base ionization of acetate is represented by the equation:
| CH3CO2−(aq) |
+ | H2O(l) | ⇌ | CH3CO2H(aq) | + | OH−(aq) | |
| I (M) | 0.0500 | -- | ~0 | 0 | |||
| C (M) | −x | (−x) | +x | +x | |||
| E (M) | 0.0500 − x | -- | x | x |
[latex]K_b = \frac {[CH_3CO_2H] \, [OH^-]}{[CH_3CO_2^-]}[/latex]
[latex]n_{OH^-} = 12.50 \cancel {mL} \: \left( \frac {1 \cancel L}{1000 \cancel {mL}} \right) \: \left( \frac {0.100 \: mol}{\cancel L} \right) = 1.25 \times 10^{-3} \: mol[/latex]
| CH3CO2H(aq) | + | OH−(aq) | → | H2O(l) | + | CH3CO2−(aq) | |
| I (mol) | 2.50 × 10⁻³ | 1.25 × 10⁻³ | -- | 0 | |||
| C (mol) | −1.25 × 10⁻³ | −1.25 × 10⁻³ | +1.25 × 10⁻³ | +1.25 × 10⁻³ | |||
| F (mol) | 1.25 × 10⁻³ | 0 | -- | 1.25 × 10⁻³ |
This volume represents one-half of the stoichiometric amount of titrant, and so one-half of the acetic acid has been neutralized to yield an equivalent amount of acetate ion. The concentrations of these conjugate acid-base partners, therefore, are equal. A convenient approach to computing the pH is use of the Henderson-Hasselbalch equation:
(d) Titrant volume = 37.50 mL.
[latex]n_{OH^-} = 37.50 \cancel {mL} \: \left( \frac {1 \cancel L}{1000 \cancel {mL}} \right) \: \left( \frac {0.100 \: mol}{\cancel L} \right) = 3.75 \times 10^{-3} \: mol[/latex]
| CH3CO2H(aq) | + | OH−(aq) | → | H2O(l) | + | CH3CO2−(aq) | |
| I (mol) | 2.50 × 10⁻³ | 3.75 × 10⁻³ | -- | 0 | |||
| C (mol) | −2.50 × 10⁻³ | −2.50 × 10⁻³ | +2.50 × 10⁻³ | +2.50 × 10⁻³ | |||
| F (mol) | 0 | 1.25 × 10⁻³ | -- | 2.50 × 10⁻³ |
This volume represents a stoichiometric excess of titrant (OH-), and a reaction solution containing both the titration product, acetate ion, and the excess strong titrant. In such solutions, the solution pH is determined primarily by the amount of excess strong base:
[latex][OH^-] = \frac {n}{V} = \frac {1.25 \times 10^{-3} \: mol}{(25.00 + 37.50) \: mL \frac {1 \: L}{1000 \: mL}} = 2.00 \times 10^{-2} \: M[/latex]
[latex]\text {pOH} = - \log {[OH^-]} = - \log {(2.00 \times 10^{-2})} = 1.70[/latex]
[latex]\text {pH} = 14.00 - \text {pOH} = 14.00 - 1.70 = 12.30[/latex]
Check Your Learning
Click here for solutions and walkthroughs for these problems!
Question 1
The Ka of formic acid is [latex]1.8 \times 10^{-4}[/latex] according to Appendix H. We can calculate the pH of a 0.100 M formic acid (HCOOH) solution using the usual ICE approach:
| HCOOH(aq) | + | H2O(l) | ⇌ | H3O+(aq) | + | HCOO−(aq) | |
| I (M) | 0.100 | -- | ~0 | 0 | |||
| C (M) | −x | (−x) | +x | +x | |||
| E (M) | 0.100 − x | -- | x | x |
[latex]n_{HCOOH} = 50.0 \cancel mL \: \left( \frac {1 \cancel L}{1000 \cancel {mL}} \right) \: \left( \frac {0.100 \: mol}{\cancel L} \right) = 5.00 \times 10^{-3} \: mol[/latex]
[latex]n_{OH^-} = 15.0 \cancel {mL} \: \left( \frac {1 \cancel L}{1000 \cancel {mL}} \right) \: \left( \frac {0.200 \: mol}{\cancel L} \right) = 3.00 \times 10^{-3} \: mol[/latex]
| HCOOH(aq) | + | OH−(aq) | → | H2O(l) | + | HCOO−(aq) | |
| I (mol) | 5.00 × 10⁻³ | 3.00 × 10⁻³ | -- | 0 | |||
| C (mol) | −3.00 × 10⁻³ | −3.00 × 10⁻³ | +3.00 × 10⁻³ | +3.00 × 10⁻³ | |||
| F (mol) | 2.00 × 10⁻³ | 0 | -- | 3.00 × 10⁻³ |
Both formic acid and its conjugate base are present in solution; a buffer has been formed. A convenient approach to computing the pH is use of the Henderson-Hasselbalch equation:
[latex]n_{HCOOH} = 50.0 \cancel mL \: \left( \frac {1 \cancel L}{1000 \cancel {mL}} \right) \: \left( \frac {0.100 \: mol}{\cancel L} \right) = 5.00 \times 10^{-3} \: mol[/latex]
[latex]n_{OH^-} = 25.0 \cancel {mL} \: \left( \frac {1 \cancel L}{1000 \cancel {mL}} \right) \: \left( \frac {0.200 \: mol}{\cancel L} \right) = 5.00 \times 10^{-3} \: mol[/latex]
| HCOOH(aq) | + | OH−(aq) | → | H2O(l) | + | HCOO−(aq) | |
| I (mol) | 5.00 × 10⁻³ | 5.00 × 10⁻³ | -- | 0 | |||
| C (mol) | −5.00 × 10⁻³ | −5.00 × 10⁻³ | +5.00 × 10⁻³ | +5.00 × 10⁻³ | |||
| F (mol) | 0 | 0 | -- | 5.00 × 10⁻³ |
HCOOH has been completely neutralized; this volume of titrant represents the equivalence point. The solution pH is computed considering the base ionization of HCOO-, which has a concentration of:
[latex][HCOO^-] = \frac {n}{V} = \frac {5.00 \times 10^{-3} \: mol}{(50.0 + 25.0) \: mL \: \left( \frac {1 \: L}{1000 \: mL} \right) } = 0.0667 \: M[/latex]
Base ionization of acetate is represented by the equation:
| HCOO−(aq) | + | H2O(l) | ⇌ | HCOOH(aq) | + | OH−(aq) | |
| I (M) | 0.0667 | -- | ~0 | 0 | |||
| C (M) | −x | (−x) | +x | +x | |||
| E (M) | 0.0667 − x | -- | x | x |
[latex]K_b = \frac {[HCOOH] \, [OH^-]}{[HCOO^-]}[/latex]
[latex]n_{OH^-} = 30.0 \cancel {mL} \: \left( \frac {1 \cancel L}{1000 \cancel {mL}} \right) \: \left( \frac {0.200 \: mol}{\cancel L} \right) = 6.00 \times 10^{-3} \: mol[/latex]
| HCOOH(aq) | + | OH−(aq) | → | H2O(l) | + | HCOO−(aq) | |
| I (mol) | 5.00 × 10⁻³ | 6.00 × 10⁻³ | -- | 0 | |||
| C (mol) | −5.00 × 10⁻³ | −5.00 × 10⁻³ | +5.00 × 10⁻³ | +5.00 × 10⁻³ | |||
| F (mol) | 0 | 1.00 × 10⁻³ | -- | 5.00 × 10⁻³ |
This volume represents a stoichiometric excess of titrant (OH-). In such solutions, the solution pH is determined primarily by the amount of excess strong base:
[latex][OH^-] = \frac {n}{V} = \frac {1.00 \times 10^{-3} \: mol}{(50.0 + 30.0) \: mL \frac {1 \: L}{1000 \: mL}} = 1.25 \times 10^{-2} \: M[/latex]
[latex]\text {pOH} = - \log {[OH^-]} = - \log {(1.25 \times 10^{-2})} = 1.90[/latex]
[latex]\text {pH} = 14.00 - \text {pOH} = 14.00 - 1.70 = 12.10[/latex]
Performing additional calculations similar to those in the preceding example permits a more full assessment of titration curves. A summary of pH/volume data pairs for the strong and weak acid titrations is provided in Table 14.2 and plotted as titration curves in Figure 14.21.
|
Volume of 0.100 M NaOH Added (mL) |
Moles of NaOH Added |
pH Values 0.100 M HCl1 |
pH Values 0.100 M CH3CO2H2
|
|---|---|---|---|
|
0.0 |
0.0 |
1.00 |
2.87 |
|
5.0 |
0.00050 |
1.18 |
4.14 |
|
10.0 |
0.00100 |
1.37 |
4.57 |
|
15.0 |
0.00150 |
1.60 |
4.92 |
|
20.0 |
0.00200 |
1.95 |
5.35 |
|
22.0 |
0.00220 |
2.20 |
5.61 |
|
24.0 |
0.00240 |
2.69 |
6.13 |
|
24.5 |
0.00245 |
3.00 |
6.44 |
|
24.9 |
0.00249 |
3.70 |
7.14 |
|
25.0 |
0.00250 |
7.00 |
8.72 |
|
25.1 |
0.00251 |
10.30 |
10.30 |
|
25.5 |
0.00255 |
11.00 |
11.00 |
|
26.0 |
0.00260 |
11.29 |
11.29 |
|
28.0 |
0.00280 |
11.75 |
11.75 |
|
30.0 |
0.00300 |
11.96 |
11.96 |
|
35.0 |
0.00350 |
12.22 |
12.22 |
|
40.0 |
0.00400 |
12.36 |
12.36 |
|
45.0 |
0.00450 |
12.46 |
12.46 |
|
50.0 |
0.00500 |
12.52 |
12.52 |
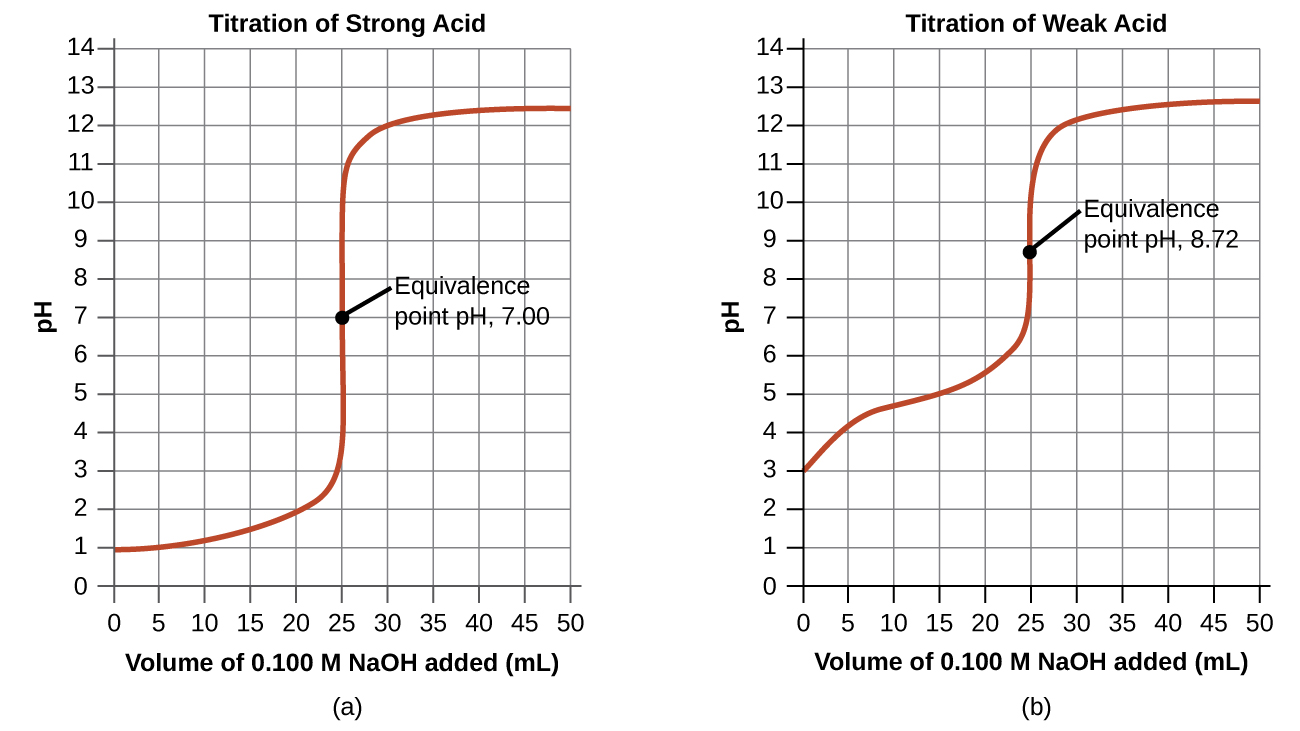
A comparison of these two titration curves (strong acid/strong base and weak acid/strong base) demonstrates the four stages of a titration:
- Initial state (added titrant volume = 0 mL): pH is determined by the acid being titrated
- because the two acid samples are equally concentrated, the strong acid exhibits a lower initial pH
- Pre-equivalence point (0 mL < V < 25 mL): solution pH increases gradually and the acid is consumed by reaction with added titrant; composition includes unreacted acid and the reaction product, its conjugate base
- for a weak acid/strong base titration, both the weak acid and its conjugate base are present, creating a buffer. In a weak acid/strong base titration curve, this region is therefore often referred to as the buffer region
- Equivalence point (V = 25 mL): occurs when equimolar amounts of acid and base are present; a drastic rise in pH is observed as the solution composition transitions from acidic to either neutral (for the strong acid sample) or basic (for the weak acid sample)
- for a strong acid/strong base titration, the pH at the equivalence point is 7
- for a weak acid/strong base titration, the pH at the equivalence point is determined by ionization of the conjugate base of the acid
- Post-equivalence point (V > 25 mL): pH is determined by the amount of excess strong base titrant added
- since both samples are titrated with the same titrant, both titration curves appear similar at this stage.
Acid-Base Indicators
Certain organic substances change color in dilute solution when the hydronium ion concentration reaches a particular value. For example, phenolphthalein is a colorless substance in any aqueous solution with a hydronium ion concentration greater than 5.0 × 10⁻⁹ M (pH < 8.3). In more basic solutions where the hydronium ion concentration is less than 5.0 × 10⁻⁹ M (pH > 8.3), it is red or pink. Substances such as phenolphthalein, which can be used to determine the pH of a solution, are called acid-base indicators. Acid-base indicators are either weak organic acids or weak organic bases.
The equilibrium in a solution of the acid-base indicator methyl orange, a weak acid, can be represented by an equation in which we use HIn as a simple representation for the complex methyl orange molecule:
The anion of methyl orange, In−, is yellow, and the nonionized form, HIn, is red. When we add acid to a solution of methyl orange, the increased hydronium ion concentration shifts the equilibrium toward the nonionized red form, in accordance with Le Châtelier’s principle. If we add base, we shift the equilibrium towards the yellow form. This behavior is completely analogous to the action of buffers.
The perceived color of an indicator solution is determined by the ratio of the concentrations of the two species In− and HIn. If most of the indicator (typically about 60−90% or more) is present as In−, the perceived color of the solution is yellow. If most is present as HIn, then the solution color appears red. The Henderson-Hasselbalch equation is useful for understanding the relationship between the pH of an indicator solution and its composition (thus, perceived color):
In solutions where pH > pKa, the logarithmic term must be positive, indicating an excess of the conjugate base form of the indicator (yellow solution). When pH < pKa, the log term must be negative, indicating an excess of the conjugate acid (red solution). When the solution pH is close to the indicator pKa, appreciable amounts of both conjugate partners are present, and the solution color is that of an additive combination of each (yellow and red, yielding orange). The color change interval (or pH interval) for an acid-base indicator is defined as the range of pH values over which a change in color is observed, and for most indicators this range is approximately pKa ± 1.
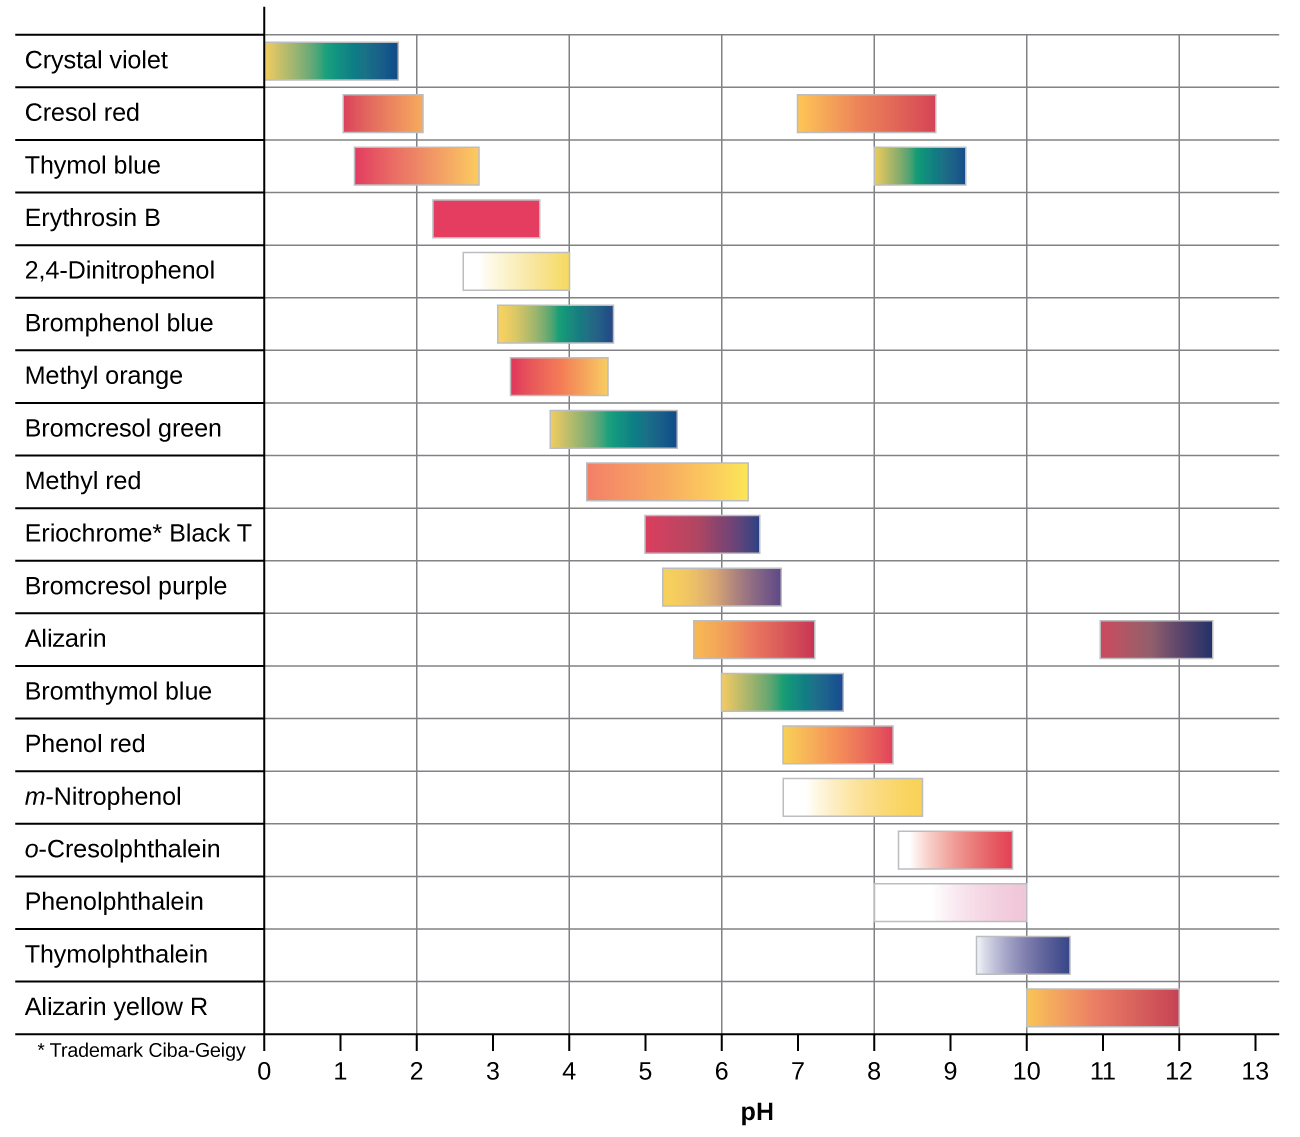
There are many different acid-base indicators that cover a wide range of pH values and can be used to determine the approximate pH of an unknown solution by a process of elimination. Universal indicators and pH paper contain a mixture of indicators and exhibit different colors at different pHs. Figure 14.22 presents several indicators, their colors, and their color-change intervals.
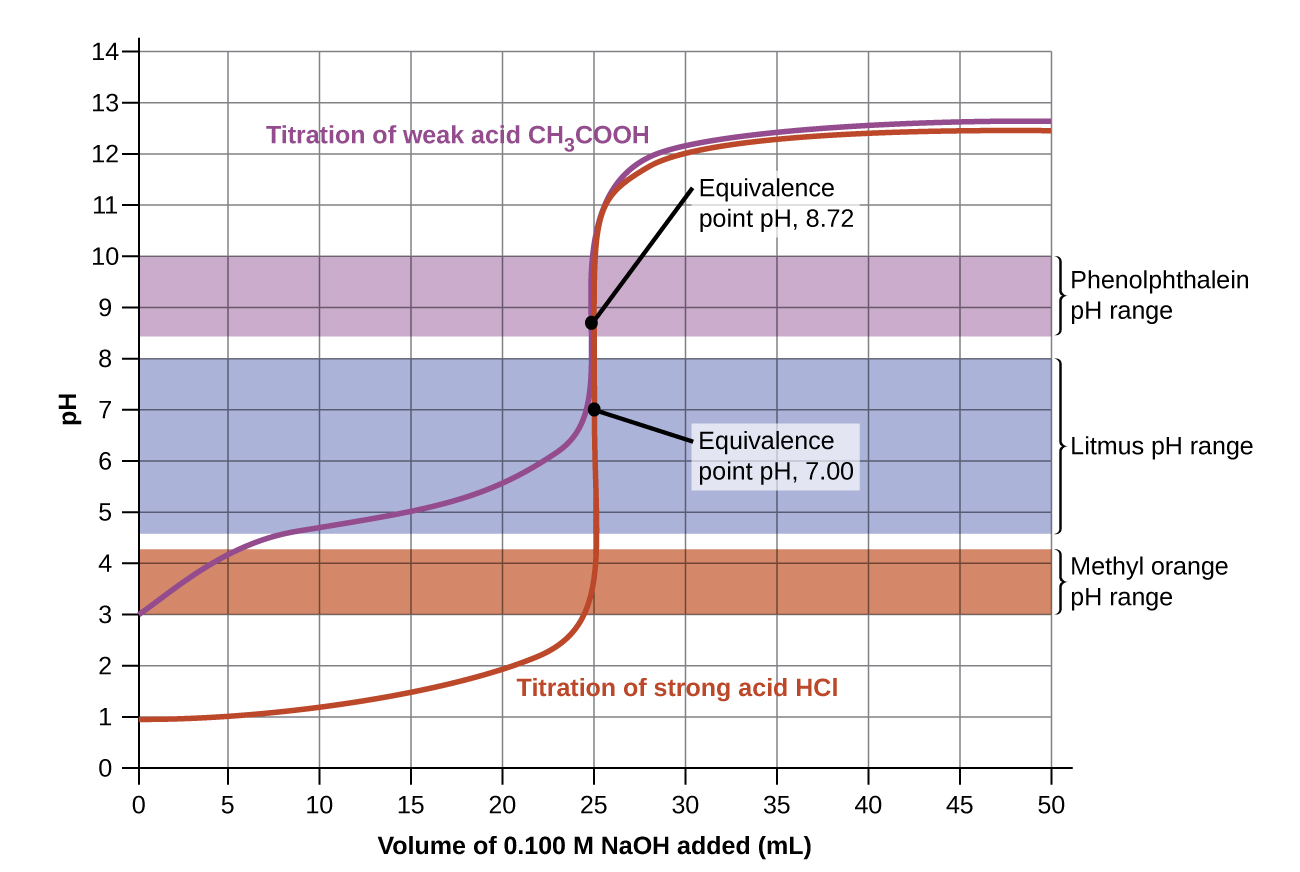
The titration curves shown in Figure 14.23 illustrate the choice of a suitable indicator for specific titrations. In the strong acid titration, use of any of the three indicators should yield reasonably sharp color changes and accurate end point determinations. For this titration, the solution pH reaches the lower limit of the methyl orange color change interval after addition of ~24 mL of titrant, at which point the initially red solution would begin to appear orange. When 25 mL of titrant has been added (the equivalence point), the pH is well above the upper limit and the solution will appear yellow. The titration's end point may then be estimated as the volume of titrant that yields a distinct orange-to-yellow color change. This color change would be challenging for most human eyes to precisely discern. More-accurate estimates of the titration end point are possible using either litmus or phenolphthalein, both of which exhibit color change intervals that are encompassed by the steep rise in pH that occurs around the 25.00 mL equivalence point.
The weak acid titration curve in Figure 14.23 shows that only one of the three indicators is suitable for end point detection. If methyl orange is used in this titration, the solution will undergo a gradual red-to-orange-to-yellow color change over a relatively large volume interval (0 to 6 mL), completing the color change well before the equivalence point (25 mL) has been reached. Use of litmus would show a color change that begins after adding 7 to 8 mL of titrant and ends just before the equivalence point. Phenolphthalein, on the other hand, exhibits a color change interval that nicely brackets the abrupt change in pH occurring at the titration's equivalence point. A sharp color change from colorless to pink will be observed within a very small volume interval around the equivalence point.
