Chapter 16 Thermodynamics
16.5 Temperature-Dependence of Spontaneity
Learning Objectives
By the end of this section, you will be able to:
- Explain how temperature affects the spontaneity of some processes
As was previously demonstrated in this chapter’s section on entropy, the spontaneity of a process may depend upon the temperature of the system. Phase transitions, for example, will proceed spontaneously in one direction or the other depending upon the temperature of the substance in question. Likewise, some chemical reactions can also exhibit temperature dependent spontaneities. To illustrate this concept, the equation relating free energy change to the enthalpy and entropy changes for the process is considered:
The spontaneity of a process, as reflected in the arithmetic sign of its free energy change, is then determined by the signs of the enthalpy and entropy changes and, in some cases, the absolute temperature. Since T is the absolute (kelvin) temperature, it can only have positive values. Four possibilities therefore exist with regard to the signs of the enthalpy and entropy changes:
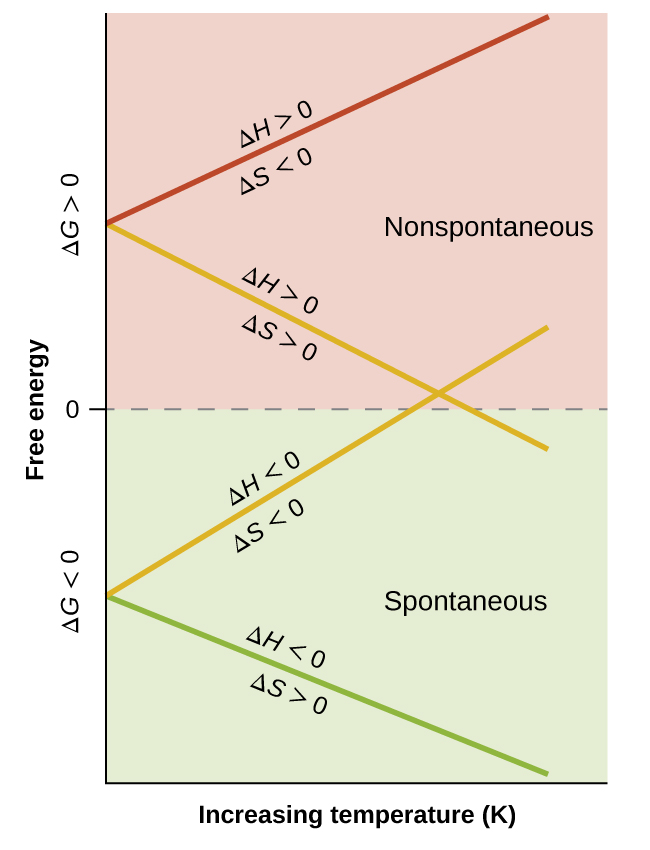
- Both ΔH and ΔS are positive.
- This condition describes an endothermic process that involves an increase in system entropy. In this case, ΔG will be negative if the magnitude of the TΔS term is greater than ΔH. If the TΔS term is less than ΔH, the free energy change will be positive.
- Such a process is spontaneous at high temperatures and nonspontaneous at low temperatures.
- Both ΔH and ΔS are negative.
- This condition describes an exothermic process that involves a decrease in system entropy. In this case, ΔG will be negative if the magnitude of the TΔS term is less than ΔH. If the TΔS term’s magnitude is greater than ΔH, the free energy change will be positive.
- Such a process is spontaneous at low temperatures and nonspontaneous at high temperatures.
- ΔH is positive and ΔS is negative.
- This condition describes an endothermic process that involves a decrease in system entropy. In this case, ΔG will be positive regardless of the temperature.
- Such a process is nonspontaneous at all temperatures.
- ΔH is negative and ΔS is positive.
- This condition describes an exothermic process that involves an increase in system entropy. In this case, ΔG will be negative regardless of the temperature.
- Such a process is spontaneous at all temperatures.
These four scenarios are summarized in Figure 16.12.

Example 16.10 – Predicting the Temperature Dependence of Spontaneity
The incomplete combustion of carbon is described by the following equation:
How does the spontaneity of this process depend upon temperature?
Solution
Combustion processes, like burning a log, release a lot of heat and are thus highly exothermic (ΔH < 0).
This particular reaction involves an increase in entropy due to the accompanying increase in the amount of gaseous species (net gain of one mole of gas, ΔS > 0).
The reaction is therefore spontaneous (ΔG < 0) at all temperatures.
Check Your Learning
Click here for an explanation of these questions!
This reaction “generates heat” and is thus exothermic (ΔH < 0).
This reaction involves a decrease in entropy due to the decrease in total number of moles and, specifically, the decrease in the amount of gaseous species (net loss of three moles of gas, ΔS < 0).
The reaction is therefore spontaneous (ΔG < 0) at only low temperatures.
When considering the conclusions drawn regarding the temperature dependence of spontaneity, it is important to keep in mind what the terms “high” and “low” mean. Since these terms are adjectives, the temperatures in question are deemed high or low relative to some reference temperature. A process that is nonspontaneous at one temperature but spontaneous at another will necessarily undergo a change in “spontaneity” (as reflected by its ΔG) as temperature varies. This is clearly illustrated by a graphical presentation of the free energy change equation, in which ΔG is plotted on the y axis versus T on the x axis:
Such a plot is shown in Figure 16.13.
As noted earlier, the condition of ΔG = 0 describes a system at equilibrium. We can calculate the temperature where ΔG = 0 (and thus the temperature where spontaneity changes) by solving for T:
So, saying a process is spontaneous at “high” or “low” temperatures means the temperature is above or below, respectively, the temperature provided by the above equation (where ΔG = 0).
Example 16.11 – Equilibrium Temperature for a Phase Transition
As defined in the chapter on liquids and solids, the boiling point of a liquid is the temperature at which its liquid and gaseous phases are in equilibrium (that is, when vaporization and condensation occur at equal rates). Use the information in Appendix G to estimate the boiling point of water.
Solution
The process of interest is the following phase change:
When this process is at equilibrium, ΔG = 0, so the following is true:
Using the standard thermodynamic data from Appendix G,
The accepted value for water’s normal boiling point is 373.2 K (100.0°C), and so this calculation is in reasonable agreement.
Note that the values for enthalpy and entropy changes data used were derived from standard data at 298 K (Appendix G). If desired, you could obtain more accurate results by using enthalpy and entropy changes determined at (or at least closer to) the actual boiling point.
Check Your Learning
