Chapter 4 Stoichiometry of Chemical Reactions
4.4 Quantitative Chemical Analysis
Learning Objectives
By the end of this section, you will be able to:
- Describe the fundamental aspects of titrations and gravimetric analysis
- Perform stoichiometric calculations using typical titration and gravimetric data
In the 18th century, the strength (actually the concentration) of vinegar samples was determined by noting the amount of potassium carbonate, K2CO3, which had to be added, a little at a time, before bubbling ceased. The greater the weight of potassium carbonate added to reach the point where the bubbling ended, the more concentrated the vinegar.
We now know that the effervescence that occurred during this process was due to a reaction with acetic acid, CH3CO2H, the compound primarily responsible for the odor and taste of vinegar. Acetic acid reacts with potassium carbonate according to the following equation:
The bubbling was due to the production of CO2.
The test of vinegar with potassium carbonate is one type of quantitative analysis—the determination of the amount or concentration of a substance in a sample. In the analysis of vinegar, the concentration of the solute (acetic acid) was determined from the amount of reactant that combined with the solute present in a known volume of the solution. In other types of chemical analyses, the amount of a substance present in a sample is determined by measuring the amount of product that results.
Titration
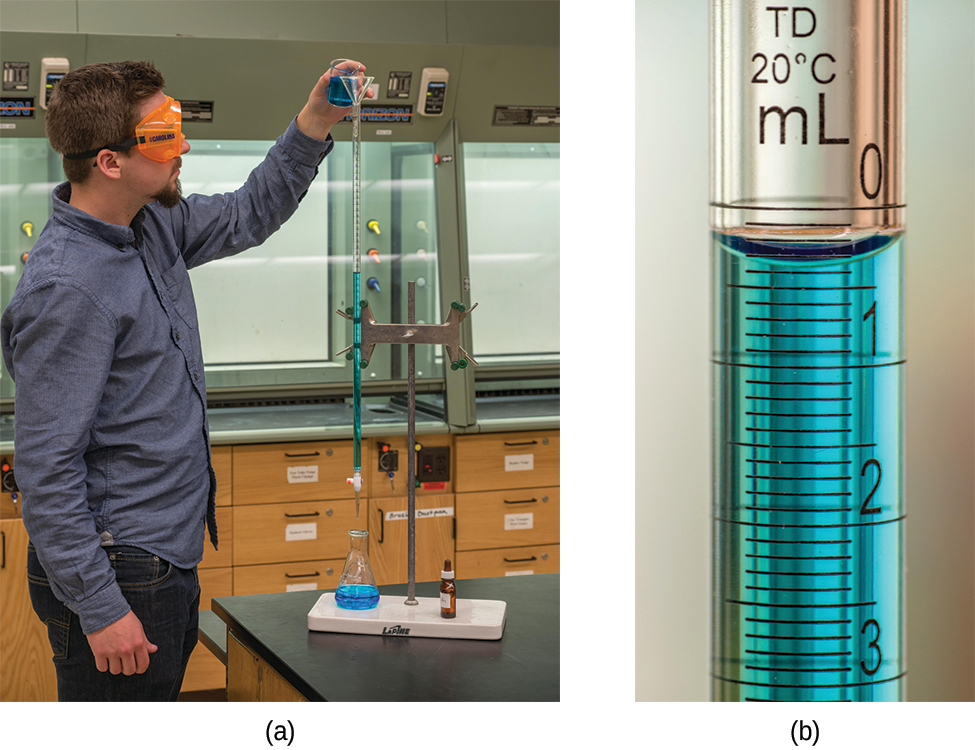
The described approach to measuring vinegar strength was an early version of the analytical technique known as titration analysis. A typical titration analysis involves the use of a buret (Figure 4.10) to make incremental additions of a solution containing a known concentration of some substance (the titrant) to a sample solution containing the substance whose concentration is to be measured (the analyte). The titrant and analyte undergo a chemical reaction of known stoichiometry, and so measuring the volume of titrant solution required for complete reaction with the analyte (the equivalence point of the titration) allows calculation of the analyte concentration. The equivalence point of a titration may be detected visually if a distinct change in the appearance of the sample solution accompanies the completion of the reaction. The halt of bubble formation in the classic vinegar analysis is one such example, though, more commonly, special dyes called indicators are added to the sample solutions to impart a change in color at or very near the equivalence point of the titration.
Equivalence points may also be detected by measuring some solution property that changes in a predictable way during the course of the titration. Regardless of the approach taken to detect a titration’s equivalence point, the volume of titrant actually measured is called the end point. Properly designed titration methods typically ensure that the difference between the equivalence and end points is negligible. Though any type of chemical reaction may serve as the basis for a titration analysis, the three described in this chapter (precipitation, acid-base, and redox) are most common. Additional details regarding titration analysis are provided in the chapter on acid-base equilibria.
Example 4.9 − Titration Analysis
The end point in a titration of a 50.00-mL sample of aqueous HCl was reached by addition of 35.23 mL of 0.250 M NaOH titrant. The titration reaction is:
Solution
As for all reaction stoichiometry calculations, the key issue is the relation between the molar amounts of the chemical species of interest as depicted in the balanced chemical equation. The approach outlined in previous modules of this chapter is followed, with additional considerations required, since the amounts of reactants provided and requested are expressed as solution concentrations.
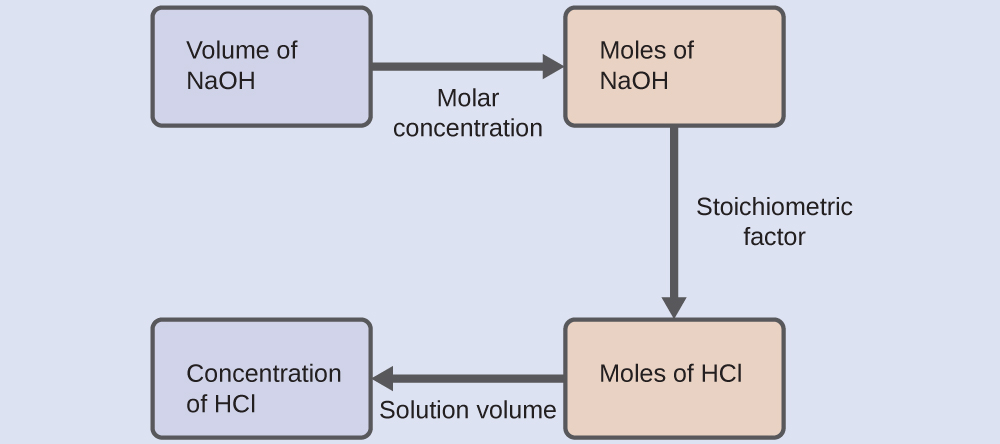
For this exercise, the calculation will follow the following outlined steps:
The molar amount of HCl is calculated to be:
Using the provided volume of HCl solution and the definition of molarity, the HCl concentration is:
Note: For these types of titration calculations, it is convenient to recognize that solution molarity is also equal to the number of millimoles of solute per milliliter of solution:
Using this version of the molarity unit will shorten the calculation by eliminating two conversion factors:
Check Your Learning
Click here for a walkthrough for this problem!
The molar amount of oxalic acid (H2C2O4) initially present is:
Using the initial volume of H2C2O4 solution and the definition of molarity, the H2C2O4 concentration is:
Gravimetric Analysis
A gravimetric analysis is one in which a sample is subjected to some treatment that causes a change in the physical state of the analyte that permits its separation from the other components of the sample. Mass measurements of the sample, the isolated analyte, or some other component of the analysis system, used along with the known stoichiometry of the compounds involved, permit calculation of the analyte concentration. Gravimetric methods were the first techniques used for quantitative chemical analysis, and they remain important tools in the modern chemistry laboratory.
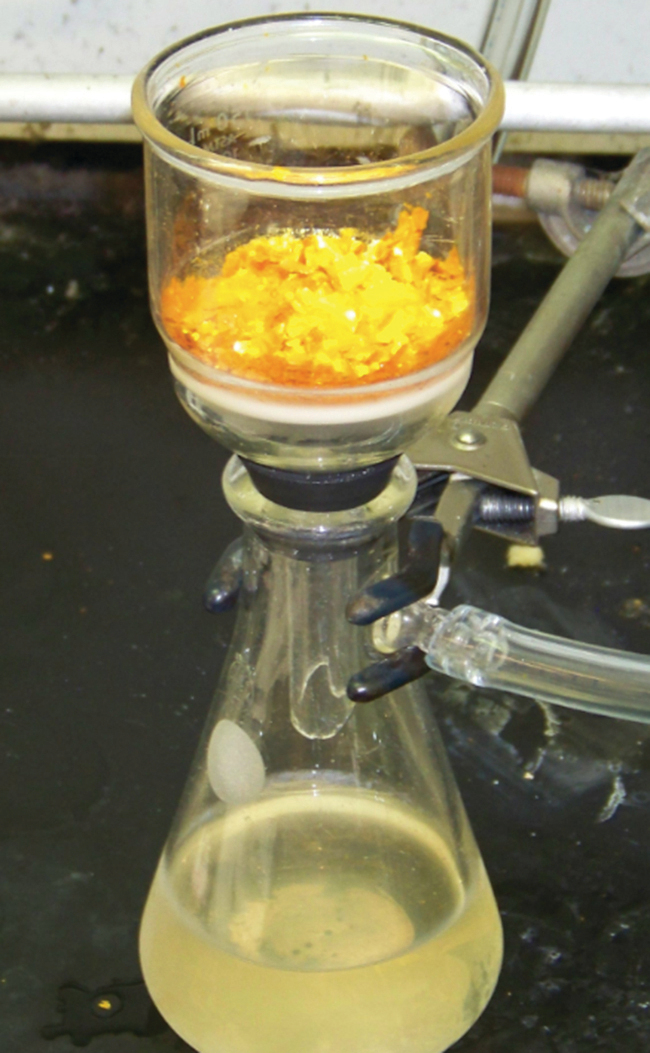
The required change of state in a gravimetric analysis may be achieved by various physical and chemical processes. For example, the moisture (water) content of a sample is routinely determined by measuring the mass of a sample before and after it is subjected to a controlled heating process that evaporates the water. Also common are gravimetric techniques in which the analyte is subjected to a precipitation reaction of the sort described earlier in this chapter. The precipitate is typically isolated from the reaction mixture by filtration, carefully dried, and then weighed (Figure 4.11). The mass of the precipitate may then be used, along with relevant stoichiometric relationships, to calculate analyte concentration.
Example 4.10 − Gravimetric Analysis
A 0.4550-g solid mixture containing MgSO4 is dissolved in water and treated with an excess of Ba(NO3)2, resulting in the precipitation of 0.6168 g of BaSO4:
What is the concentration (mass percent) of MgSO4 in the mixture?
Solution
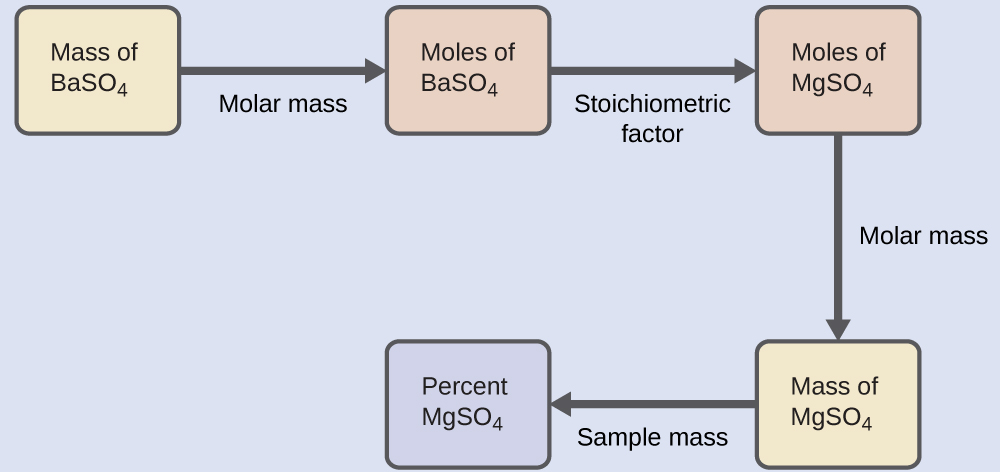
The plan for this calculation is similar to others used in stoichiometric calculations, the central step being the connection between the moles of BaSO4 and MgSO4 through their stoichiometric factor. Once the mass of MgSO4 is computed, it may be used along with the mass of the sample mixture to calculate the requested percentage concentration.
The mass of MgSO4 that would yield the provided precipitate mass is:
The mass percent of MgSO4 in the sample mixture is then calculated to be:
Check Your Learning
Click here for a walkthrough for this problem!
The plan is:
- Convert mass of the product AgCl to moles of AgCl using the molar mass.
- Convert moles of AgCl produced to moles of Cl- used using the stoichiometric ratio.
- Convert moles of Cl- used to mass of Cl- using the molar mass.
- Calculate the percent of Cl- using the sample mass.
The first three steps can be accomplished in one calculation via dimensional analysis:
The mass percent of Cl- in the sample mixture is then calculated to be:
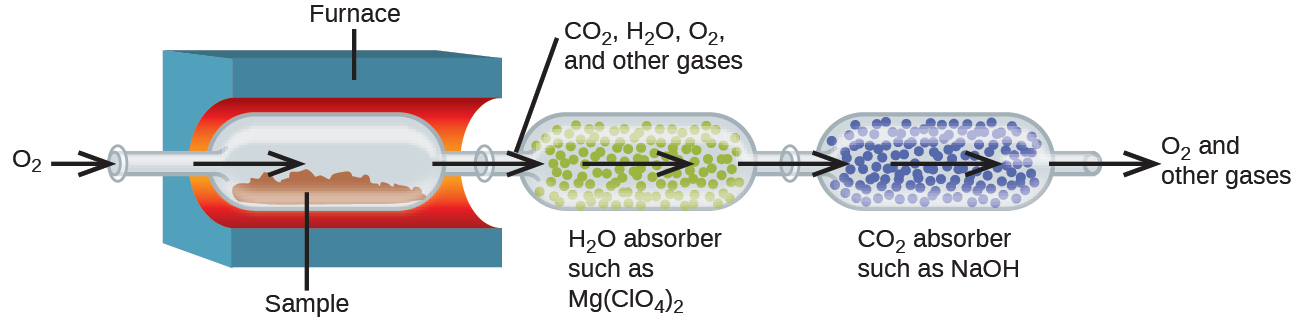
The elemental composition of hydrocarbons and related compounds may be determined via a gravimetric method known as combustion analysis. In a combustion analysis, a weighed sample of the compound is heated to a high temperature under a stream of oxygen gas, resulting in its complete combustion to yield gaseous products of known identities. The complete combustion of hydrocarbons, for example, will yield carbon dioxide and water as the only products. The gaseous combustion products are swept through separate, pre-weighed collection devices containing compounds that selectively absorb each product (Figure 4.12). The mass increase of each device corresponds to the mass of the absorbed product and may be used in an appropriate stoichiometric calculation to derive the mass of the relevant element.
Example 4.11 − Combustion Analysis
Polyethylene is a hydrocarbon polymer used to produce food-storage bags and many other flexible plastic items. A combustion analysis of a 0.00126-g sample of polyethylene yields 0.00394 g of CO2 and 0.00161 g of H2O. What is the empirical formula of polyethylene?
Solution
The primary assumption in this exercise is that all the carbon in the sample combusted is converted to carbon dioxide, and all the hydrogen in the sample is converted to water:
Note that a balanced equation is not necessary for the task at hand. To derive the empirical formula of the compound, only the subscripts x and y are needed.
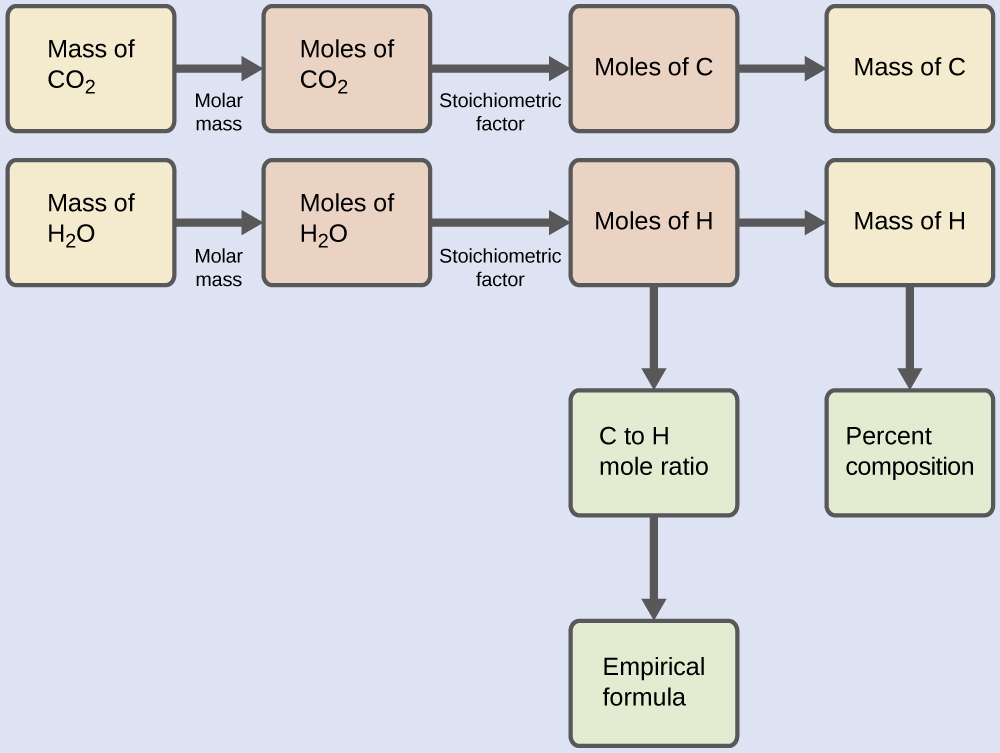
First, calculate the molar amounts of carbon and hydrogen in the sample, using the provided masses of carbon dioxide and water, respectively. With these molar amounts, the empirical formula for the compound may be written as described in the previous chapter of this text. An outline of this approach is given in the following flowchart:
The empirical formula for the compound is then derived by identifying the smallest whole-number multiples for these molar amounts. The H-to-C molar ratio is:
and the empirical formula for polyethylene is CH2.
Check Your Learning
Click here for a walkthrough of this problem!
First, you can calculate the molar amounts of carbon and hydrogen in the sample using the provided masses of carbon dioxide and water:
The empirical formula for the compound is then derived by identifying the smallest whole-number multiples for these molar amounts. The H-to-C molar ratio is:
and the empirical formula for polystyrene is CH.
