Chapter 9 Gases
9.2 Relating Pressure, Volume, Amount and Temperature: Gas Laws
Learning Objectives
By the end of this section, you will be able to:
- Identify the mathematical relationships between the various properties of gases
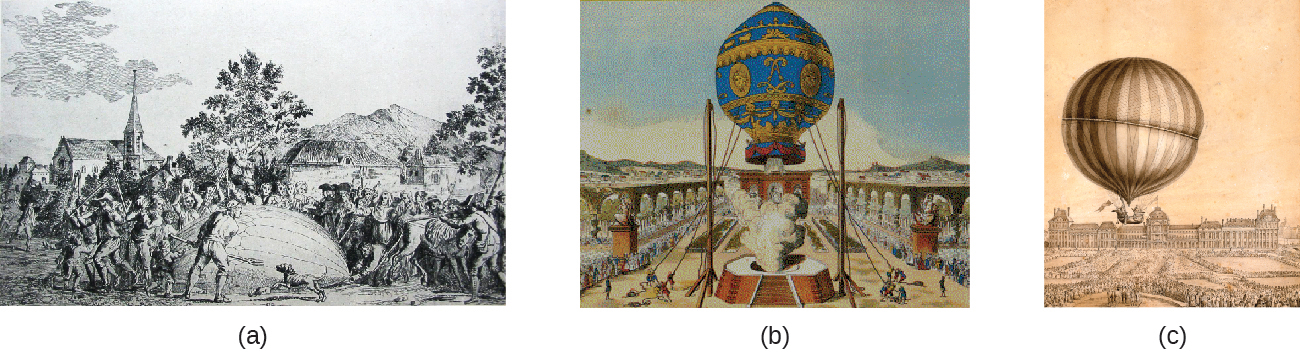
During the 17th and especially 18th centuries, driven both by a desire to understand nature and a quest to make balloons in which they could fly (Figure 9.9), a number of scientists established the relationships between the macroscopic physical properties of gases: pressure, volume, temperature, and amount of gas. Although their measurements were not precise by today’s standards, they were able to determine the mathematical relationships between pairs of these variables (e.g., pressure and temperature, pressure and volume) that hold for an ideal gas—a hypothetical construct that real gases approximate under certain conditions. Eventually, these individual laws were combined into a single equation—the ideal gas law—that relates gas quantities for gases and is quite accurate for low pressures and moderate temperatures. We will consider the key developments in individual relationships (for pedagogical reasons not quite in historical order), then put them together in the ideal gas law.
Pressure and Temperature: Amontons's Law
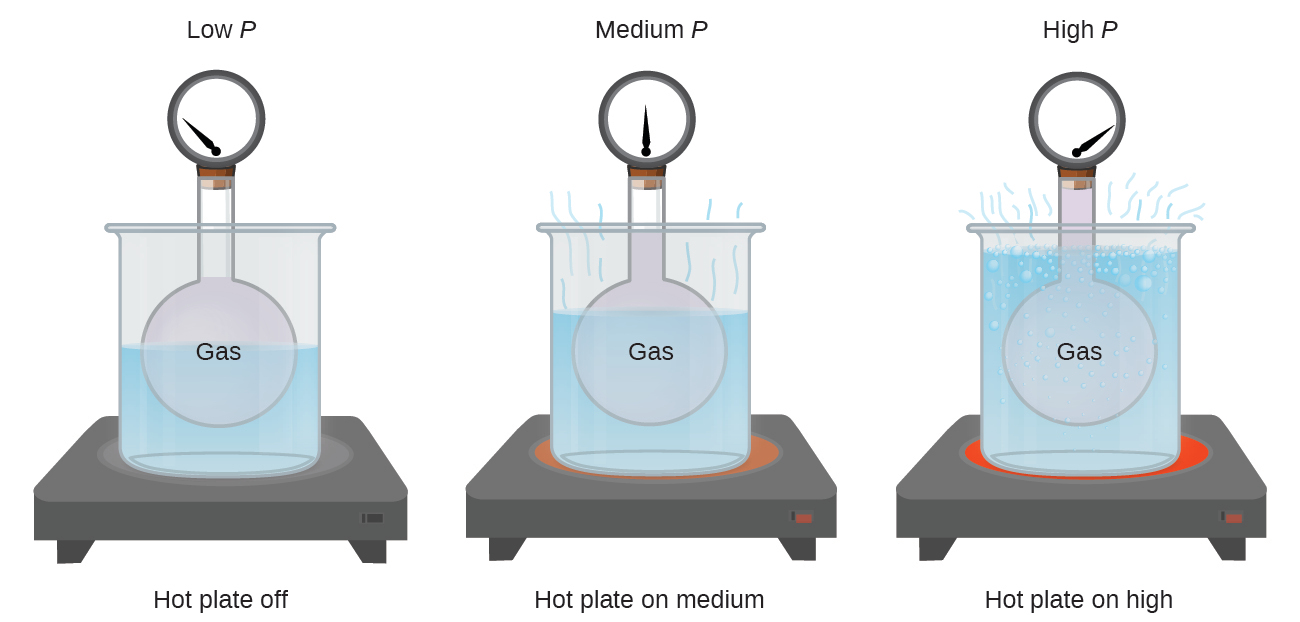
Imagine filling a rigid container attached to a pressure gauge with gas and then sealing the container so that no gas may escape. If the container is cooled, the gas inside likewise gets colder and its pressure is observed to decrease. Since the container is rigid and tightly sealed, both the volume and number of moles of gas remain constant. If we heat the sphere, the gas inside gets hotter (Figure 9.10) and the pressure increases.
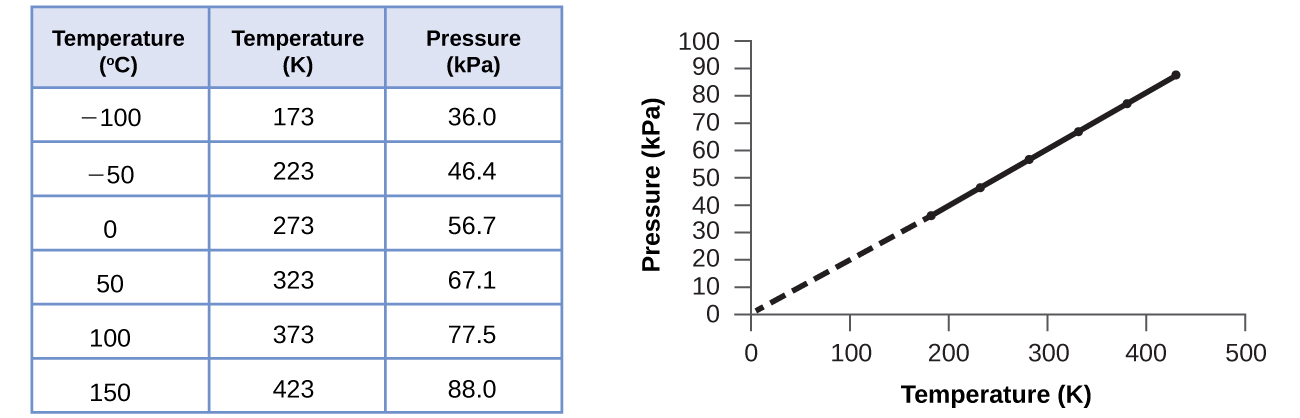
This relationship between temperature and pressure is observed for any sample of gas confined to a constant volume. An example of experimental pressure-temperature data is shown for a sample of air under these conditions in Figure 9.11. We find that temperature and pressure are linearly related, and if the temperature is on the Kelvin scale, then P and T are directly proportional (again, when volume and moles of gas are held constant); if the temperature on the Kelvin scale increases by a certain factor, the gas pressure increases by the same factor.
Guillaume Amontons was the first to empirically establish the relationship between the pressure and the temperature of a gas (~1700), and Joseph Louis Gay-Lussac determined the relationship more precisely (~1800). Because of this, the P-T relationship for gases is known as either Amontons’s law or Gay-Lussac’s law. Under either name, it states that the pressure of a given amount of gas is directly proportional to its temperature on the Kelvin scale when the volume is held constant. Mathematically, this can be written as follows:
where [latex]\propto[/latex] means “is proportional to,” and k is a proportionality constant that depends on the identity, amount, and volume of the gas.
For a confined, constant volume of gas, the ratio P/T is therefore constant (i.e., PT = k). If the gas is initially in “Condition 1” (with P = P1 and T = T1), and then changes to “Condition 2” (with P = P2 and T = T2), we have that:
This equation is useful for pressure-temperature calculations for a confined gas at constant volume. Note that temperatures must be on the Kelvin scale for any gas law calculations. (A 0 on the Kelvin scale is called absolute zero. It is the lowest possible temperature.)
Example 9.5. Predicting Change in Pressure with Temperature
A can of hair spray is used until it is empty except for the propellant, isobutane gas.
(a) On the can is the warning “Store only at temperatures below 120°F (48.8°C). Do not incinerate.” Why?
(b) The gas in the can is initially at 24°C and 360 kPa, and the can has a volume of 350 mL. If the can is left in a car that reaches 50°C on a hot day, what is the new pressure in the can?
Solution
(a) The can contains an amount of isobutane gas at a constant volume, so if the temperature is increased by heating, the pressure will increase proportionately. High temperature could lead to high pressure, causing the can to burst. (Also, isobutane is combustible, so incineration could cause the can to explode.)
(b) We are looking for a pressure change due to a temperature change at constant volume, so we will use Amontons’s/Gay-Lussac’s law. Taking P1 and T1 as the initial values, T2 as the temperature where the pressure is unknown and P2 as the unknown pressure, and converting °C to K, we have:
Rearranging and solving gives:
Check Your Learning
Volume and Temperature: Charles's Law
If we fill a balloon with air and seal it, the balloon contains a specific amount of air at atmospheric pressure (approximately 1 atm). If we put the balloon in a refrigerator, the gas inside gets cold and the balloon shrinks (although both the amount of gas and its pressure remain constant). If we make the balloon very cold, it will shrink a great deal, and it expands again when it warms up.
Link to Learning
This video shows how cooling and heating a gas causes its volume to decrease or increase, respectively.
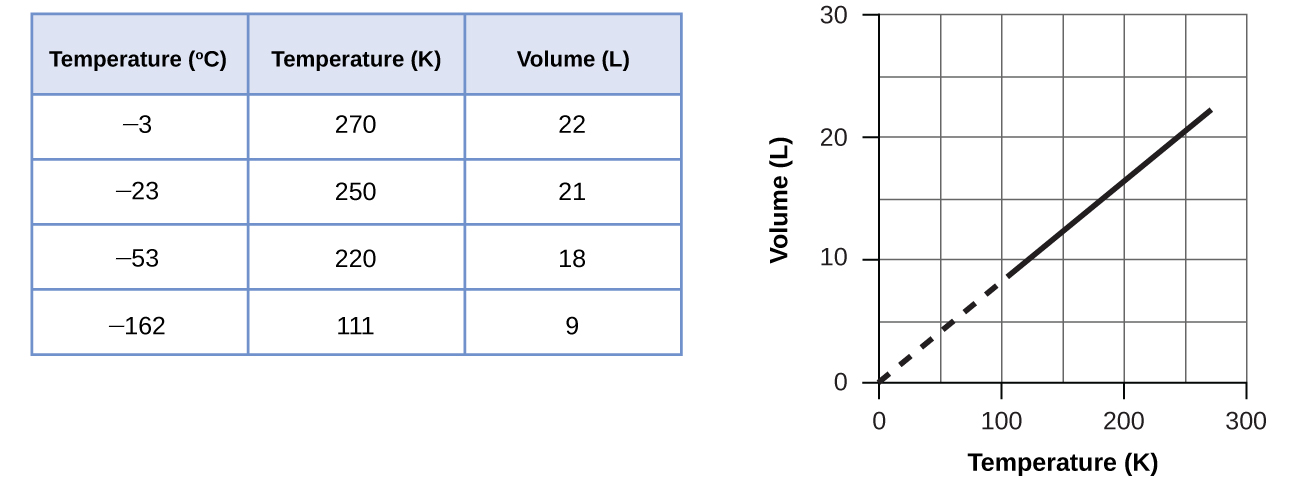
These examples of the effect of temperature on the volume of a given amount of a confined gas at constant pressure are true in general: The volume increases as the temperature increases, and decreases as the temperature decreases. Volume-temperature data for a 1-mole sample of methane gas at 1 atm are listed and graphed in Figure 9.12.
The relationship between the volume and temperature of a given amount of gas at constant pressure is known as Charles’s law in recognition of the French scientist and balloon flight pioneer Jacques Alexandre César Charles. Charles’s law states that the volume of a given amount of gas is directly proportional to its temperature on the Kelvin scale when the pressure is held constant.
Mathematically, this can be written as:
For a confined, constant pressure gas sample, V/T is constant (i.e., the ratio = k), and as seen with the P-T relationship, this leads to another form of Charles’s law:
Example 9.6. Predicting Change in Volume with Temperature
A sample of carbon dioxide, CO2, occupies 0.300 L at 10°C and 750 torr. What volume will the gas have at 30°C and 750 torr?
Solution
Because we are looking for the volume change caused by a temperature change at constant pressure, this is a job for Charles’s law. Taking V1 and T1 as the initial values, T2 as the temperature at which the volume is unknown and V2 as the unknown volume, and converting °C into K we have:
Rearranging and solving gives:
This answer supports our expectation from Charles’s law, namely, that raising the gas temperature (from 283 K to 303 K) at a constant pressure will yield an increase in its volume (from 0.300 L to 0.321 L).
Check Your Learning
Example 9.7. Measuring Temperature with a Volume Change
Temperature is sometimes measured with a gas thermometer by observing the change in the volume of the gas as the temperature changes at constant pressure. The hydrogen in a particular hydrogen gas thermometer has a volume of 150.0 cm3 when immersed in a mixture of ice and water (0.00°C). When immersed in boiling liquid ammonia, the volume of the hydrogen, at the same pressure, is 131.7 cm3. Find the temperature of boiling ammonia on the Kelvin and Celsius scales.
Solution
A volume change caused by a temperature change at constant pressure means we should use Charles’s law. Taking V1 and T1 as the initial values, T2 as the temperature at which the volume is unknown and V2 as the unknown volume, and converting °C into K we have:
Subtracting 273.15 from 239.8 K, we find that the temperature of the boiling ammonia on the Celsius scale is –33.4°C.
Check Your Learning
What is the volume of a sample of ethane at 467 K and 1.1 atm if it occupies 405 mL at 298 K and 1.1 atm?
Click here for the answer!
635 mL
Volume and Pressure: Boyle's Law
If we partially fill an airtight syringe with air, the syringe contains a specific amount of air at constant temperature, say 25°C. If we slowly push in the plunger while keeping temperature constant, the gas in the syringe is compressed into a smaller volume and its pressure increases; if we pull out the plunger, the volume increases and the pressure decreases. This example of the effect of volume on the pressure of a given amount of a confined gas is true in general. Decreasing the volume of a contained gas will increase its pressure, and increasing its volume will decrease its pressure. In fact, if the volume increases by a certain factor, the pressure decreases by the same factor, and vice versa. Volume-pressure data for an air sample at room temperature are graphed in Figure 9.13.
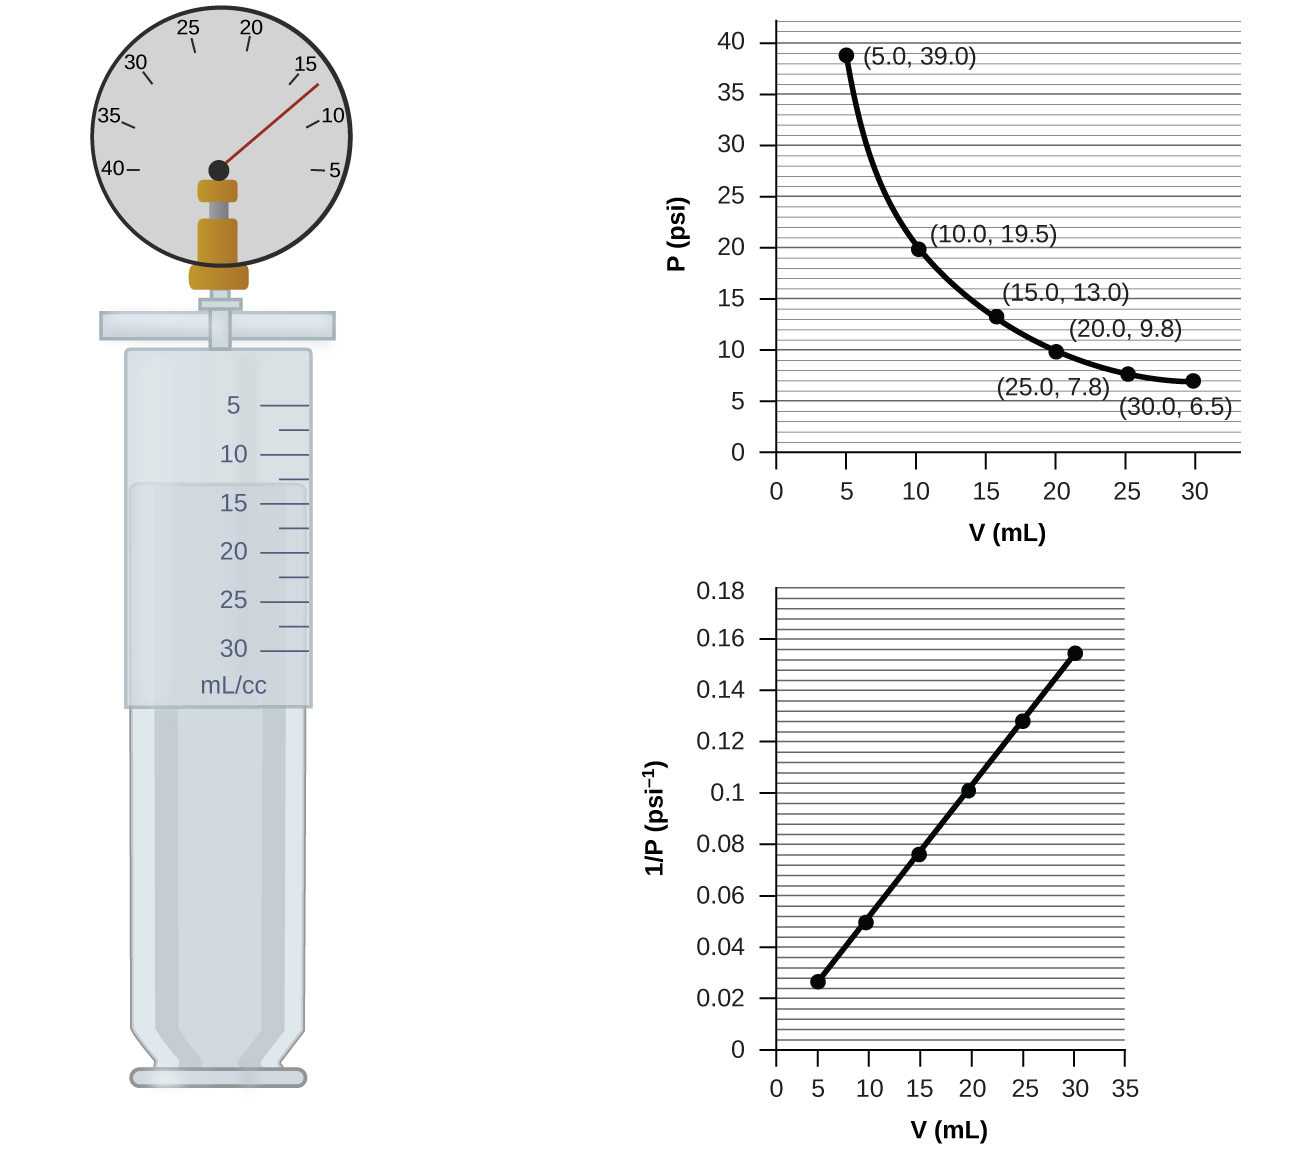
Unlike the P-T and V-T relationships, pressure and volume are not directly proportional to each other. Instead, P and V exhibit inverse proportionality: Increasing the pressure results in a decrease of the volume of the gas. Mathematically this can be written:
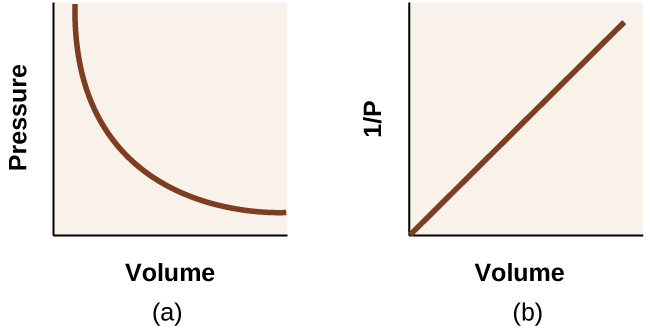
with k being a constant. Graphically, this relationship is shown by the straight line that results when plotting the inverse of the pressure 1/P versus the volume (V), or the inverse of volume 1/V versus the pressure (P). Graphs with curved lines are difficult to read accurately at low or high values of the variables, and they are more difficult to use in fitting theoretical equations and parameters to experimental data. For those reasons, scientists often try to find a way to “linearize” their data. If we plot P versus V, we obtain a hyperbola (Figure 9.14).
The relationship between the volume and pressure of a given amount of gas at constant temperature was first published by the English natural philosopher Robert Boyle over 300 years ago. It is summarized in the statement now known as Boyle’s law: The volume of a given amount of gas held at constant temperature is inversely proportional to the pressure under which it is measured.
Example 9.8. Volume of a Gas Sample
The sample of gas in Figure 9.13 has a volume of 15.0 mL at a pressure of 13.0 psi. Determine the pressure of the gas at a volume of 7.5 mL, using:
(a) the P-V graph in Figure 9.13
Comment on the likely accuracy of each method.
Solution
(a) Estimating from the P-V graph gives a value for P somewhere around 27 psi.
(b) Estimating from the 1/P versus V graph gives a value of about 26 psi.
(c) From Boyle’s law, we know that the product of pressure and volume (PV) for a given sample of gas at a constant temperature is always equal to the same value.
Therefore we have P1V1 = k and P2V2 = k which means that P1V1 = P2V2.
Using P1 and V1 as the known values 13.0 psi and 15.0 mL, P2 as the pressure at which the volume is unknown, and V2 as the unknown volume, we have:
Solving:
It was more difficult to estimate well from the P-V graph, so (a) is likely more inaccurate than (b) or (c). The calculation will be as accurate as the equation and measurements allow.
Check Your Learning
The sample of gas in Figure 9.13 has a volume of 30.0 mL at a pressure of 6.5 psi. Determine the volume of the gas at a pressure of 11.0 psi, using:
(a) the P-V graph in Figure 9.13
Comment on the likely accuracy of each method.
Click here for the answers!
(a) about 17–18 mL
(b) ~18 mL
(c) 17.7 mL
It was more difficult to estimate well from the P-V graph, so (a) is likely more inaccurate than (b); the calculation will be as accurate as the equation and measurements allow.
Chemistry in Everyday Life
Breathing and Boyle’s Law
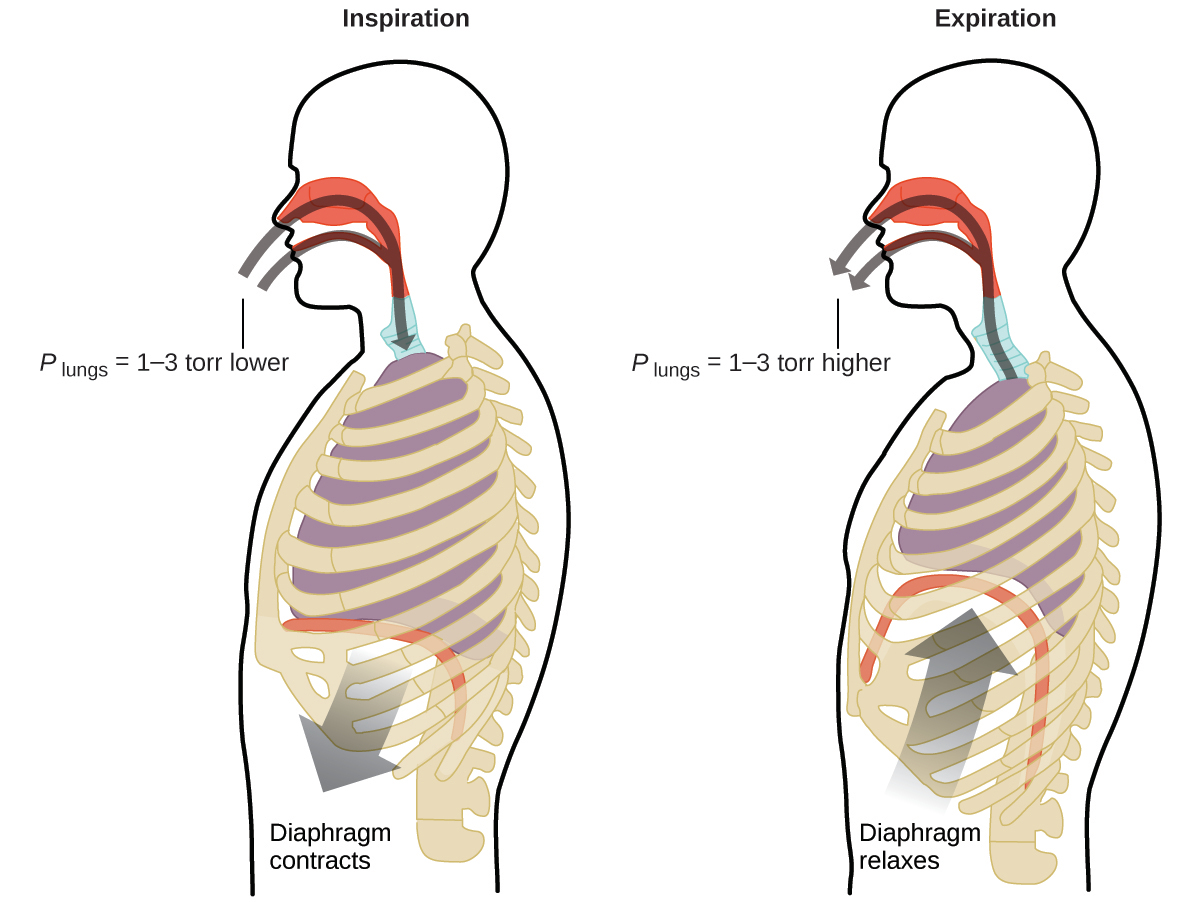
What do you do about 20 times per minute for your whole life, without break, and often without even being aware of it? The answer, of course, is respiration, or breathing. How does it work? It turns out that the gas laws apply here. Your lungs take in gas that your body needs (oxygen) and get rid of waste gas (carbon dioxide). Lungs are made of spongy, stretchy tissue that expands and contracts while you breathe. When you inhale, your diaphragm and intercostal muscles (the muscles between your ribs) contract, expanding your chest cavity and making your lung volume larger. The increase in volume leads to a decrease in pressure (Boyle’s law). This causes air to flow into the lungs (from high pressure to low pressure). When you exhale, the process reverses: your diaphragm and rib muscles relax, your chest cavity contracts, and your lung volume decreases, causing the pressure to increase (Boyle’s law again), and air flows out of the lungs (from high pressure to low pressure). You then breathe in and out again, and again, repeating this Boyle’s law cycle for the rest of your life (Figure 9.15).
Moles of Gas and Volume: Avogadro's Law
The Italian scientist Amedeo Avogadro advanced a hypothesis in 1811 to account for the behavior of gases, stating that equal volumes of all gases, measured under the same conditions of temperature and pressure, contain the same number of molecules. Over time, this relationship was supported by many experimental observations as expressed by Avogadro’s law: For a confined gas, the volume (V) and number of moles (n) are directly proportional if the pressure and temperature both remain constant.
In equation form, this is written as:
Mathematical relationships can also be determined for the other variable pairs, such as P versus n, and n versus T.
Link to Learning
Visit this interactive PhET simulation to investigate the relationships between pressure, volume, temperature, and amount of gas. Use the simulation to examine the effect of changing one parameter to another while holding the other parameters constant (as described in the preceding sections on the various gas laws).
