Chapter 16. Metabolism and Nutrition
16.2 Carbohydrate Metabolism
Learning Objectives
By the end of this section, you will be able to:
- Describe how the body digests carbohydrates
- Describe how, when, and why the body metabolizes carbohydrates
- Explain the processes of glycolysis
- Describe the pathway of a pyruvate molecule through the Krebs cycle
- Explain the transport of electrons through the electron transport chain
- Describe the process of adenosine triphosphate (ATP) production through oxidative phosphorylation
- Summarize the process of gluconeogenesis
Carbohydrates are organic molecules composed of carbon, hydrogen, and oxygen atoms. The family of carbohydrates includes both simple and complex sugars. Glucose and fructose are examples of simple sugars, and starch, glycogen, and cellulose are all examples of complex sugars. The complex sugars are also called polysaccharides and are made of multiple monosaccharide molecules. Polysaccharides serve as energy storage (e.g., starch and glycogen) and as structural components (e.g., chitin in insects and cellulose in plants).
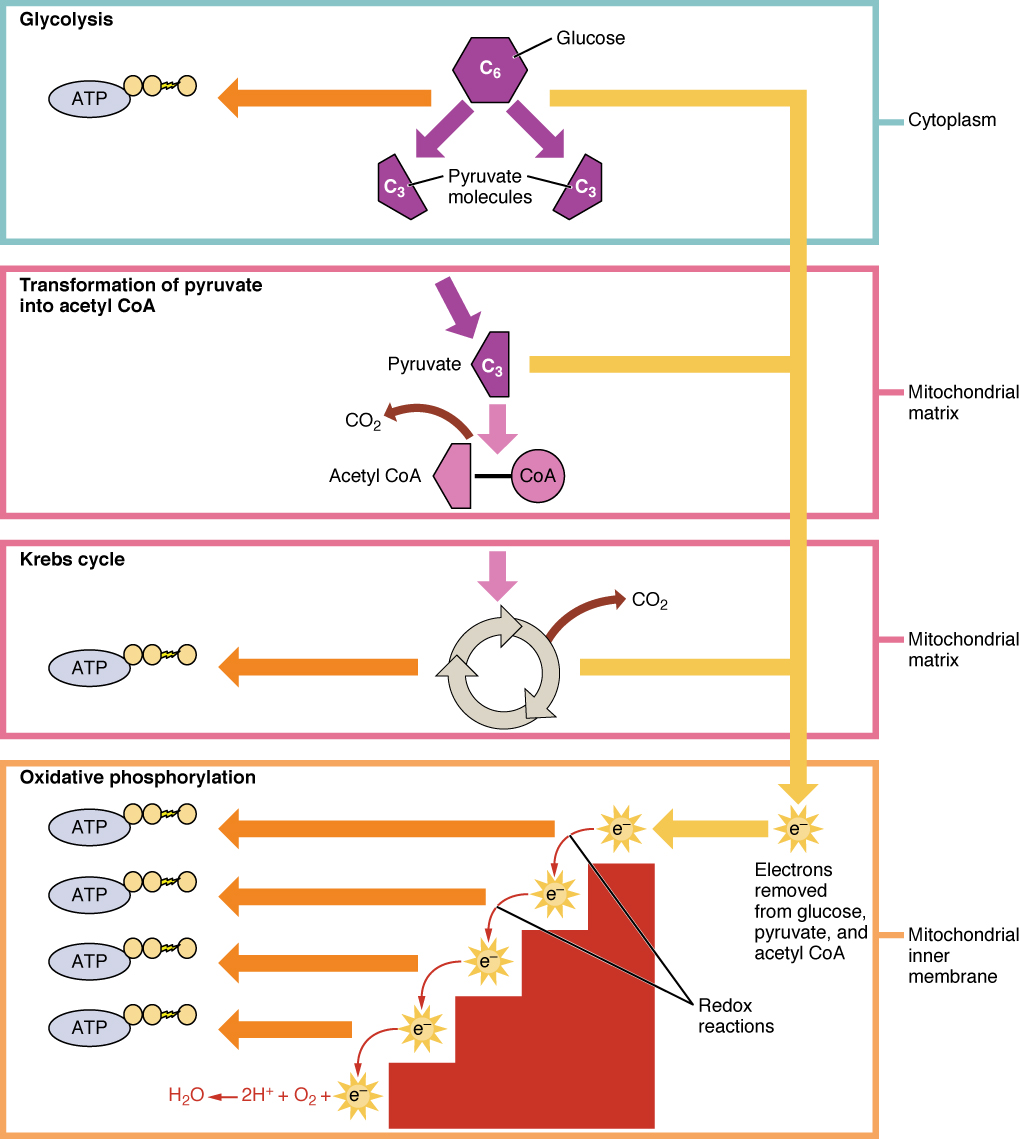
During digestion, carbohydrates are broken down into simple, soluble sugars that can be transported across the intestinal wall into the circulatory system to be transported throughout the body. Carbohydrate digestion begins in the mouth with the action of salivary amylase on starches, continues in the duodenum with the action of pancreatic amylase, and ends with monosaccharides being absorbed across the epithelium of the small intestine. Once the absorbed monosaccharides are transported to the tissues, the process of cellular respiration begins (Figure 16.2.1). The goal of cellular respiration is to produce adenosine triphosphate (ATP) for use by the body to power physiological processes. To start the process, a glucose molecule will get modified to two pyruvate molecules in the metabolic pathway called glycolysis. When oxygen is available, the pyruvate molecules will then be converted to acetyl CoA which enters the mitochondria and enters the citric acid cycle. Both glycolysis and the citric acid cycle produce a small amount of ATP (2 ATP per pathway), but the majority of the ATP produced by aerobic metabolism is achieved when the products of glycolysis and the citric acid, NADH and FADH2, carry their electrons to the electron transport chain. The electron transport chain transfers electrons through electron carriers, ultimately to oxygen in a process called oxidative phosphorylation. This final process of cellular respiration harnesses the energy delivered by NADH and FADH2 to drive ATP synthase to produce 34 ATP per glucose. This first section will focus first on glycolysis, a process where the monosaccharide glucose is oxidized, releasing the energy stored in its bonds to produce ATP.
Glycolysis
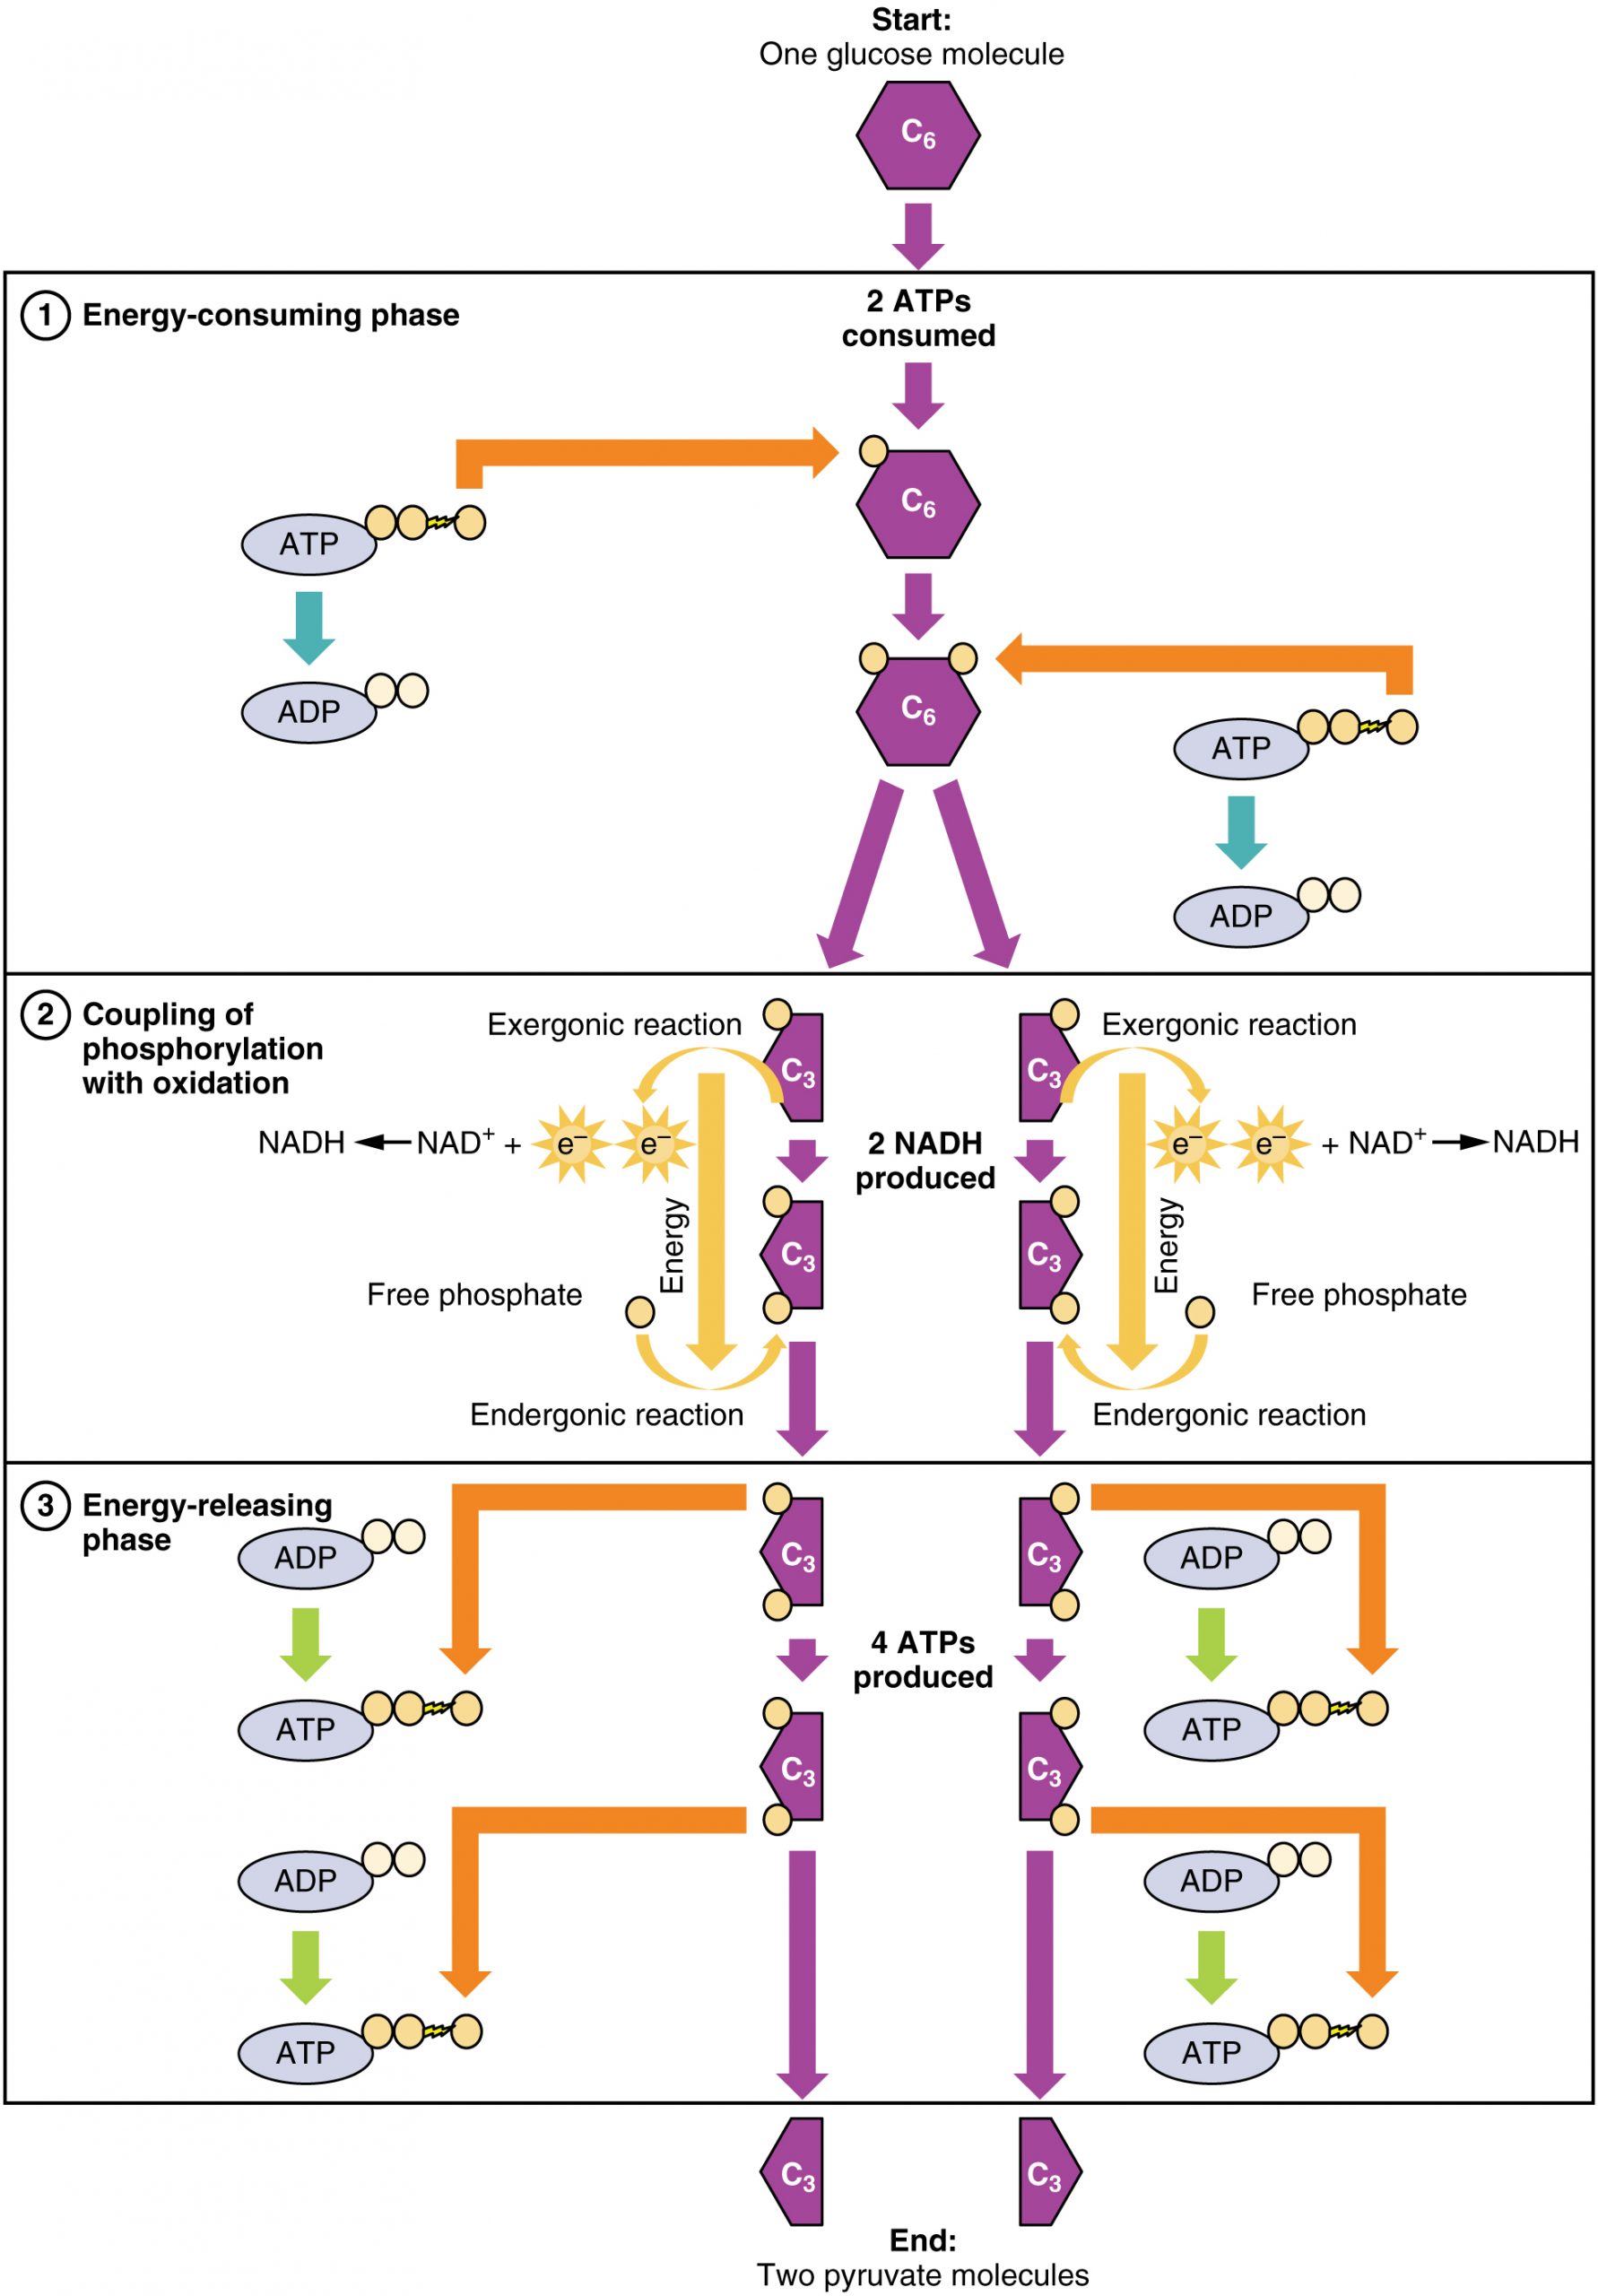
Glucose is the body’s most readily available source of energy. After digestive processes break polysaccharides down into monosaccharides, including glucose, the monosaccharides are transported across the wall of the small intestine and into the circulatory system, which transports them to the liver. In the liver, hepatocytes either pass the glucose on through the circulatory system or store excess glucose as glycogen. Cells in the body take up the circulating glucose in response to insulin and, through a series of reactions called glycolysis, transfer some of the energy in glucose to ADP to form ATP (Figure 16.2.2). The last step in glycolysis produces the product pyruvate.
Glycolysis begins with the phosphorylation of glucose by hexokinase to form glucose-6-phosphate. This step uses one ATP, which is the donor of the phosphate group. Under the action of phosphofructokinase, glucose-6-phosphate is converted into fructose-6-phosphate. At this point, a second ATP donates its phosphate group, forming fructose-1,6-bisphosphate. This six-carbon sugar is split to form two phosphorylated three-carbon molecules, glyceraldehyde-3-phosphate and dihydroxyacetone phosphate, which are both converted into glyceraldehyde-3-phosphate. The glyceraldehyde-3-phosphate is further phosphorylated with groups donated by dihydrogen phosphate present in the cell to form the three-carbon molecule 1,3-bisphosphoglycerate. The energy of this reaction comes from the oxidation of (removal of electrons from) glyceraldehyde-3-phosphate. In a series of reactions leading to pyruvate, the two phosphate groups are then transferred to two ADPs to form two ATPs. Thus, glycolysis uses two ATPs but generates four ATPs, yielding a net gain of two ATPs and two molecules of pyruvate. In the presence of oxygen, pyruvate continues on to the Krebs cycle (also called the citric acid cycle or tricarboxylic acid cycle (TCA), where additional energy is extracted and passed on.
External Website
 Watch this video to learn about glycolysis.
Glycolysis can be divided into two phases: energy consuming (also called chemical priming) and energy yielding. The first phase is the energy-consuming phase, so it requires two ATP molecules to start the reaction for each molecule of glucose. However, the end of the reaction produces four ATPs, resulting in a net gain of two ATP energy molecules.
Glycolysis can be expressed as the following equation:
This equation states that glucose, in combination with ATP (the energy source), NAD+ (a coenzyme that serves as an electron acceptor), and inorganic phosphate, breaks down into two pyruvate molecules, generating four ATP molecules—for a net yield of two ATP—and two energy-containing NADH coenzymes. The NADH that is produced in this process will be used later to produce ATP in the mitochondria. Importantly, by the end of this process, one glucose molecule generates two pyruvate molecules, two high-energy ATP molecules, and two electron-carrying NADH molecules.
The following discussions of glycolysis include the enzymes responsible for the reactions. When glucose enters a cell, the enzyme hexokinase (or glucokinase, in the liver) rapidly adds a phosphate to convert it into glucose-6-phosphate. A kinase is a type of enzyme that adds a phosphate molecule to a substrate (in this case, glucose, but it can be true of other molecules also). This conversion step requires one ATP and essentially traps the glucose in the cell, preventing it from passing back through the plasma membrane, thus allowing glycolysis to proceed. It also functions to maintain a concentration gradient with higher glucose levels in the blood than in the tissues. By establishing this concentration gradient, the glucose in the blood will be able to flow from an area of high concentration (the blood) into an area of low concentration (the tissues) to be either used or stored. Hexokinase is found in nearly every tissue in the body. Glucokinase, on the other hand, is expressed in tissues that are active when blood glucose levels are high, such as the liver. Hexokinase has a higher affinity for glucose than glucokinase and therefore is able to convert glucose at a faster rate than glucokinase. This is important when levels of glucose are very low in the body, as it allows glucose to travel preferentially to those tissues that require it more.
In the next step of the first phase of glycolysis, the enzyme glucose-6-phosphate isomerase converts glucose-6-phosphate into fructose-6-phosphate. Like glucose, fructose is also a six carbon-containing sugar. The enzyme phosphofructokinase-1 then adds one more phosphate to convert fructose-6-phosphate into fructose-1-6-bisphosphate, another six-carbon sugar, using another ATP molecule. Aldolase then breaks down this fructose-1-6-bisphosphate into two three-carbon molecules, glyceraldehyde-3-phosphate and dihydroxyacetone phosphate. The triosephosphate isomerase enzyme then converts dihydroxyacetone phosphate into a second glyceraldehyde-3-phosphate molecule. Therefore, by the end of this chemical-priming or energy-consuming phase, one glucose molecule is broken down into two glyceraldehyde-3-phosphate molecules.
The second phase of glycolysis, the energy-yielding phase, creates the energy that is the product of glycolysis. Glyceraldehyde-3-phosphate dehydrogenase converts each three-carbon glyceraldehyde-3-phosphate produced during the energy-consuming phase into 1,3-bisphosphoglycerate. This reaction releases an electron that is then picked up by NAD+ to create an NADH molecule. NADH is a high-energy molecule, like ATP, but unlike ATP, it is not used as energy currency by the cell. Because there are two glyceraldehyde-3-phosphate molecules, two NADH molecules are synthesized during this step. Each 1,3-bisphosphoglycerate is subsequently dephosphorylated (i.e., a phosphate is removed) by phosphoglycerate kinase into 3-phosphoglycerate. Each phosphate released in this reaction can convert one molecule of ADP into one high-energy ATP molecule, resulting in a gain of two ATP molecules.
The enzyme phosphoglycerate mutase then converts the 3-phosphoglycerate molecules into 2-phosphoglycerate. The enolase enzyme then acts upon the 2-phosphoglycerate molecules to convert them into phosphoenolpyruvate molecules. The last step of glycolysis involves the dephosphorylation of the two phosphoenolpyruvate molecules by pyruvate kinase to create two pyruvate molecules and two ATP molecules.
In summary, one glucose molecule breaks down into two pyruvate molecules, and creates two net ATP molecules and two NADH molecules by glycolysis. Therefore, glycolysis generates energy for the cell and creates pyruvate molecules that can be processed further through the aerobic Krebs cycle (also called the citric acid cycle or tricarboxylic acid cycle); converted into lactic acid or alcohol (in yeast) by fermentation; or used later for the synthesis of glucose through gluconeogenesis.
Anaerobic Respiration
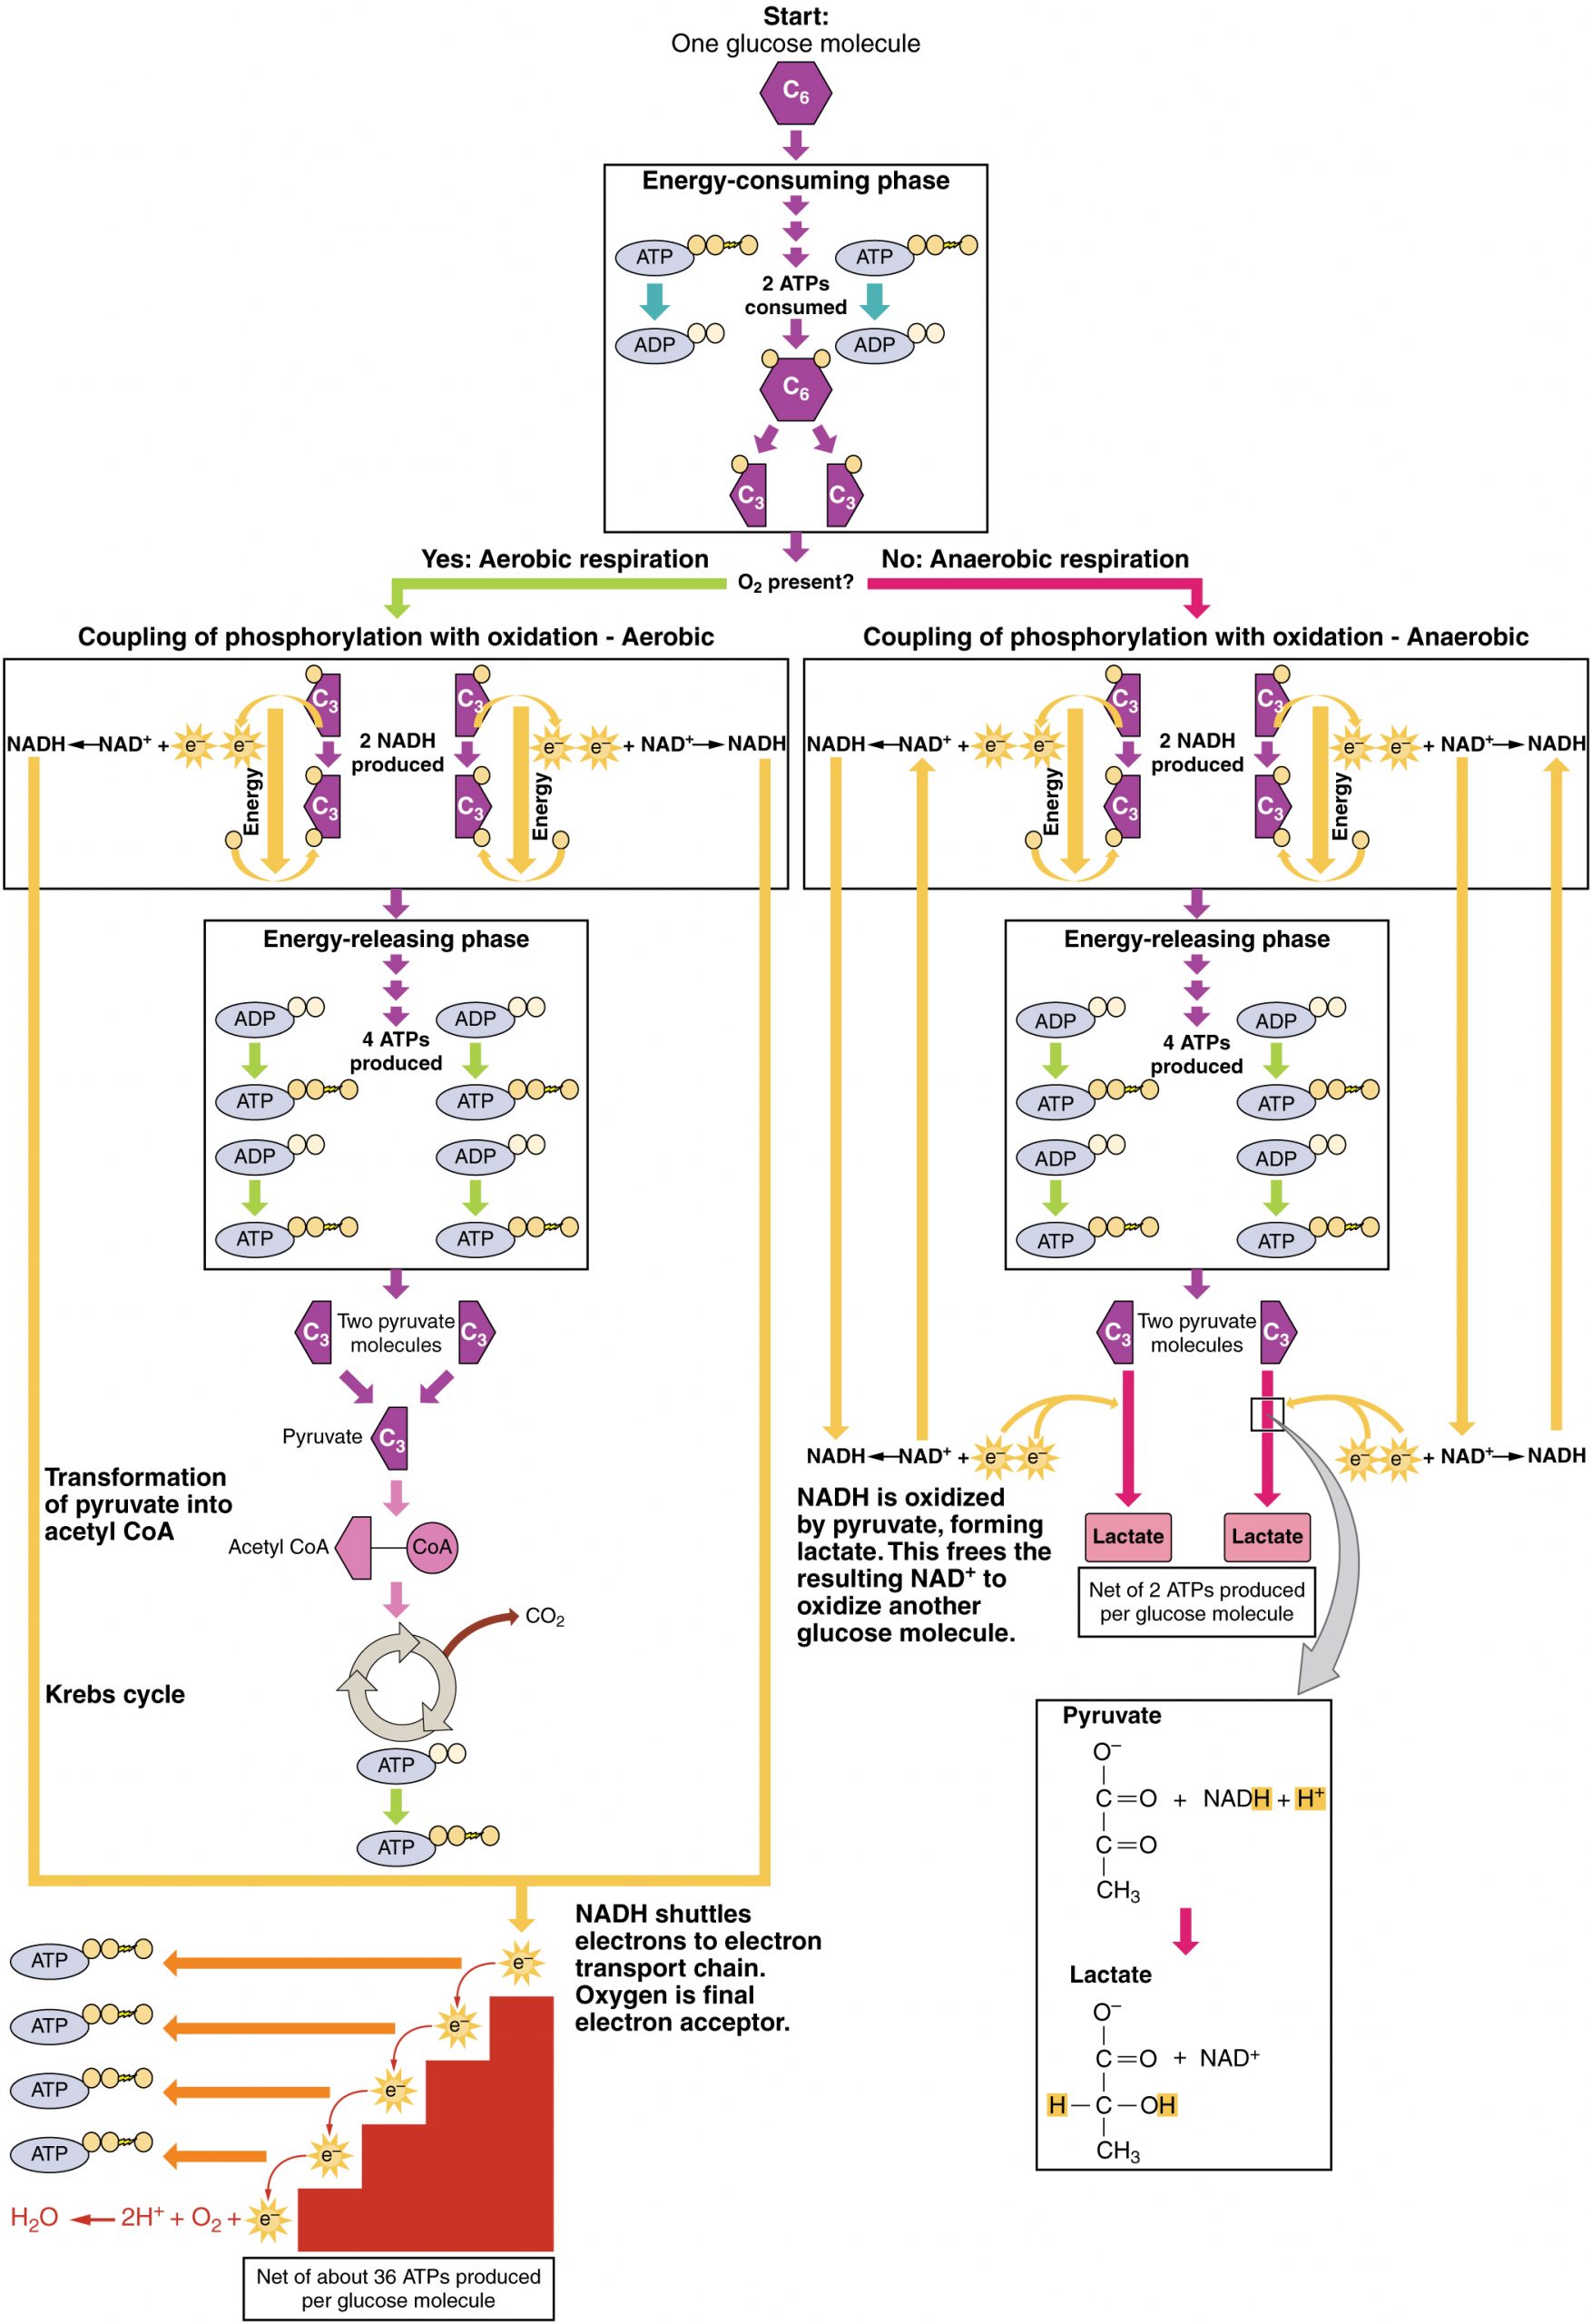
When oxygen is limited or absent, pyruvate enters an anaerobic pathway. In these reactions, pyruvate can be converted into lactic acid. In addition to generating an additional ATP, this pathway serves to keep the pyruvate concentration low so glycolysis continues, and it oxidizes NADH into the NAD+ needed by glycolysis. In this reaction, lactic acid replaces oxygen as the final electron acceptor. Anaerobic respiration occurs in most cells of the body when oxygen is limited or mitochondria are absent or nonfunctional. For example, because erythrocytes (red blood cells) lack mitochondria, they must produce their ATP from anaerobic respiration. This is an effective pathway of ATP production for short periods of time, ranging from seconds to a few minutes. The lactic acid produced diffuses into the plasma and is carried to the liver, where it is converted back into pyruvate or glucose via the Cori cycle. Similarly, when a person exercises, muscles use ATP faster than oxygen can be delivered to them. They depend on glycolysis and lactic acid production for rapid ATP production.
Aerobic Respiration
In the presence of oxygen, pyruvate can enter the Krebs cycle where additional energy is extracted as electrons are transferred from the pyruvate to the receptors NAD+, GDP, and FAD, with carbon dioxide being a “waste product” (Figure 16.2.3). The NADH and FADH2 pass electrons on to the electron transport chain, which uses the transferred energy to produce ATP. As the terminal step in the electron transport chain, oxygen is the terminal electron acceptor and creates water inside the mitochondria.
Krebs Cycle/Citric Acid Cycle/Tricarboxylic Acid Cycle
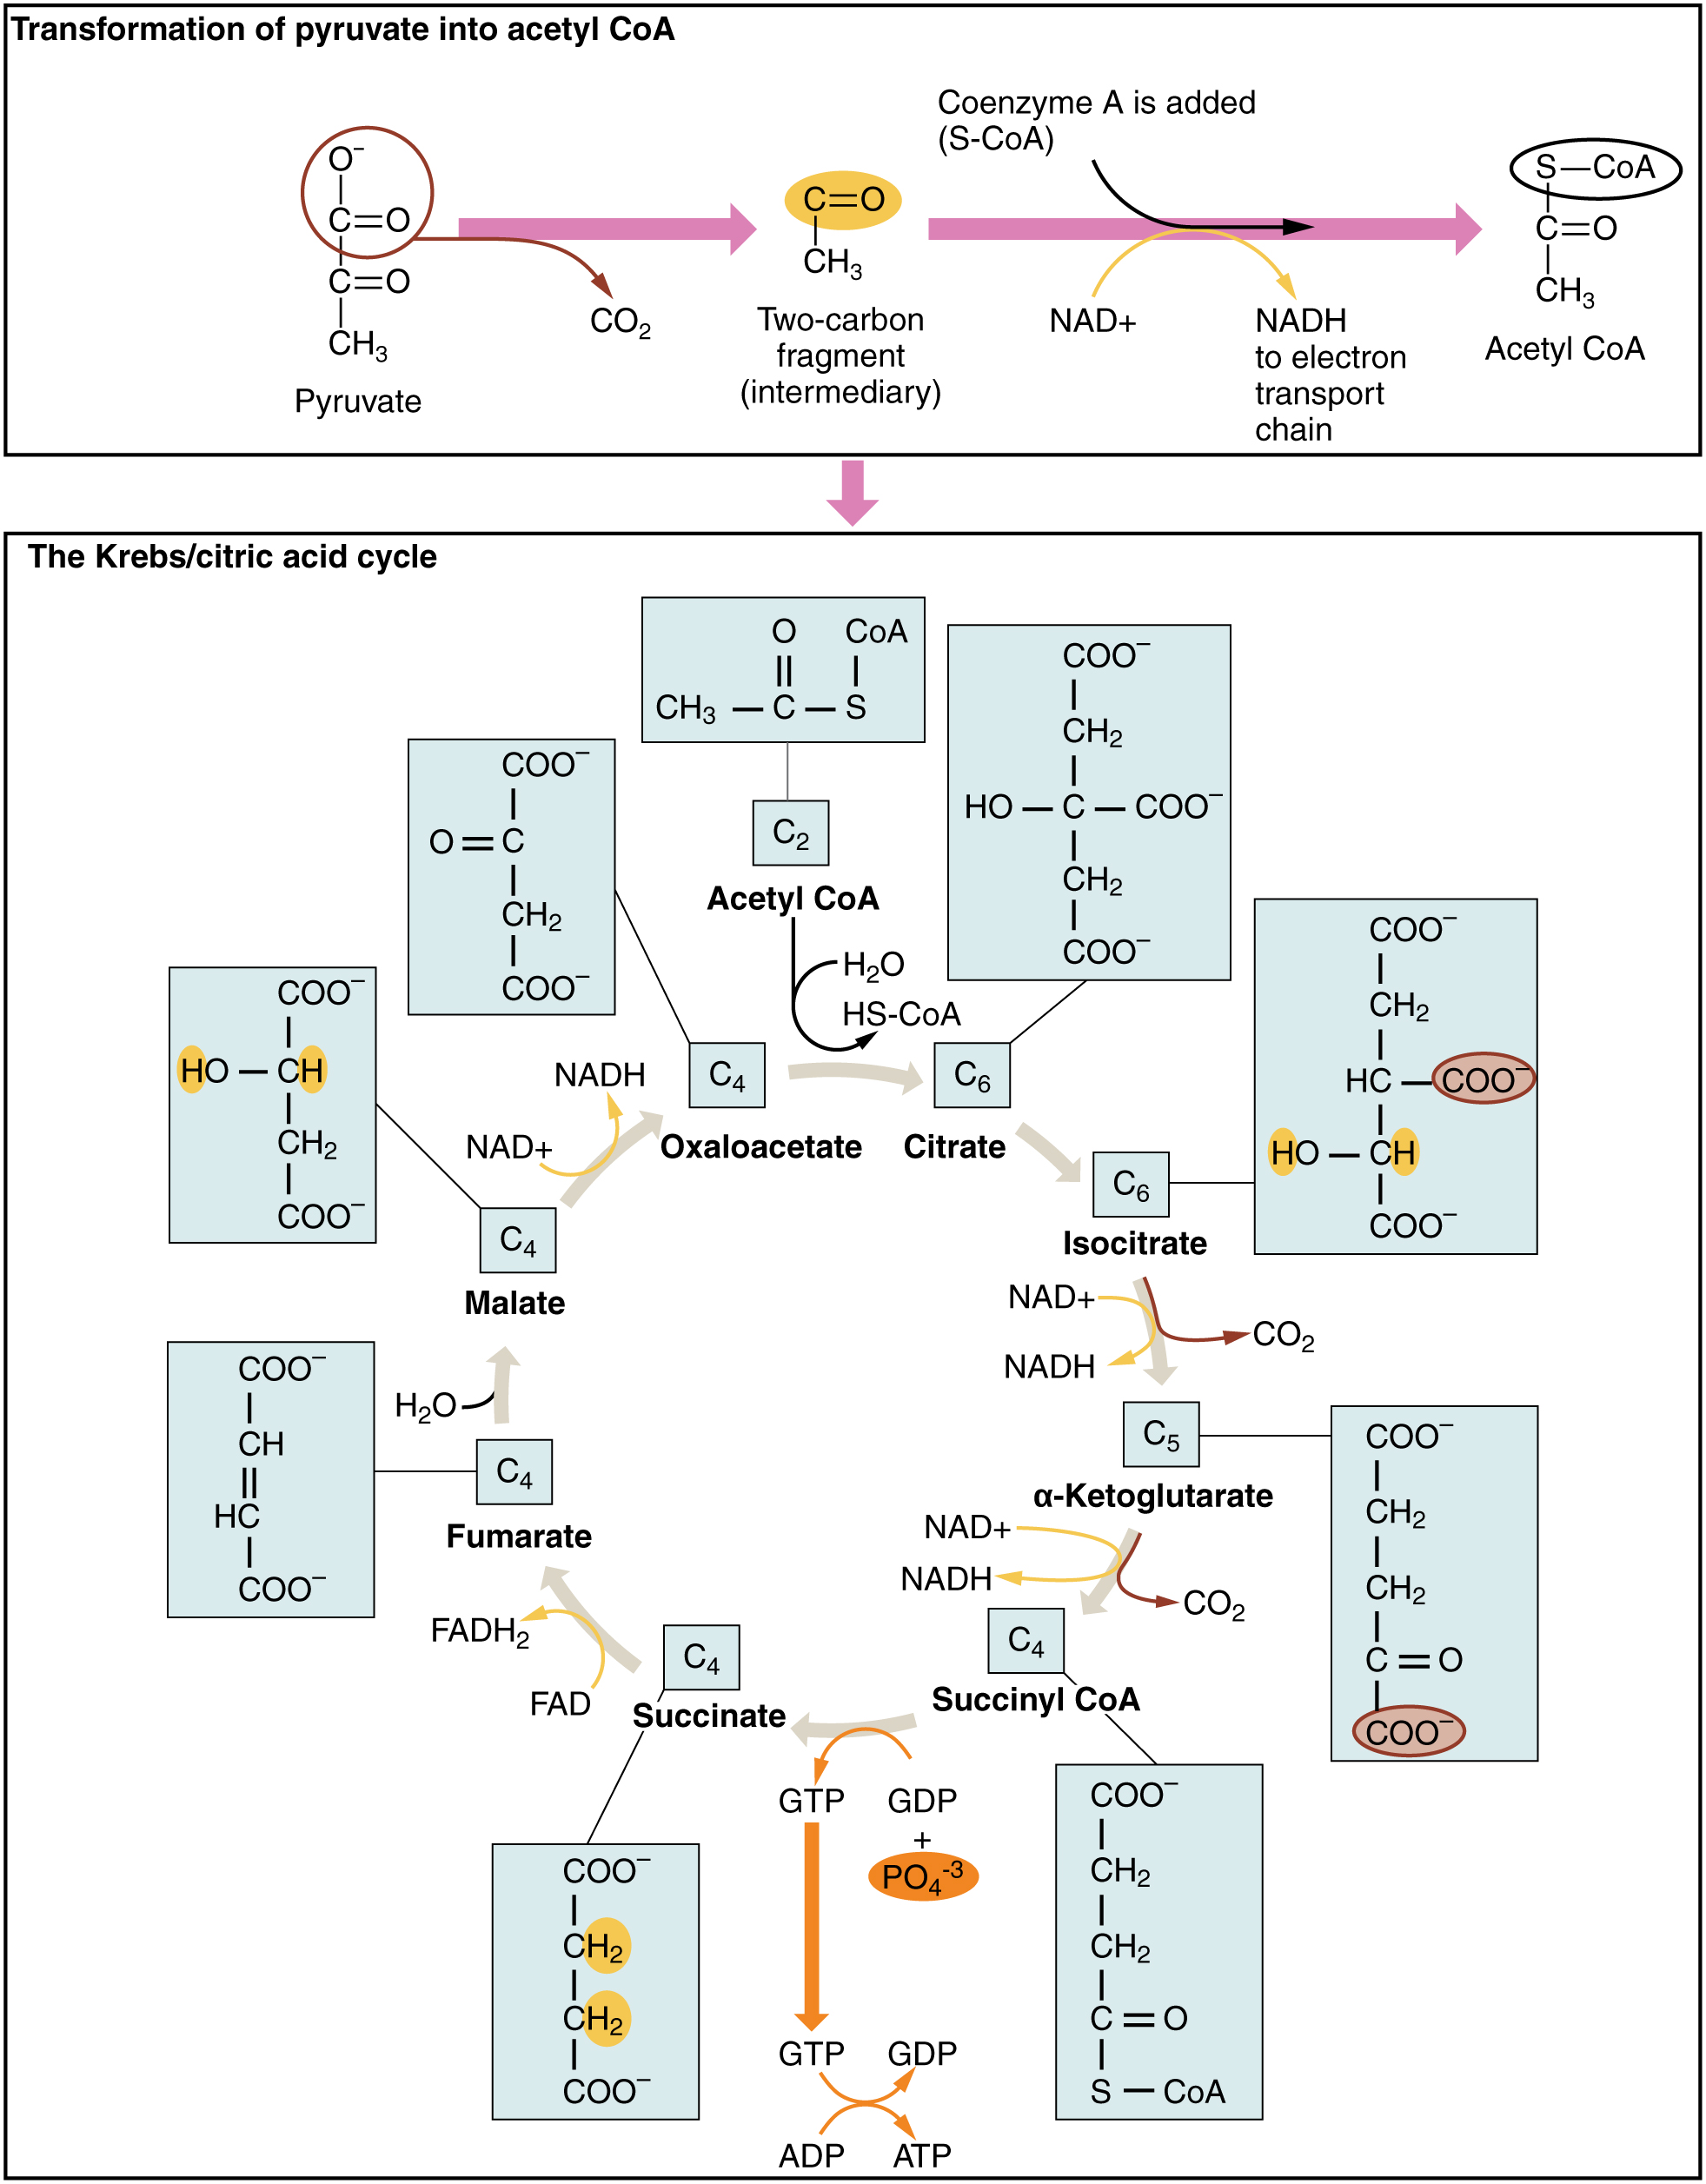
The pyruvate molecules generated during glycolysis are transported across the mitochondrial membrane into the inner mitochondrial matrix, where they are metabolized by enzymes in a pathway called the Krebs cycle (Figure 16.2.4). The Krebs cycle is also commonly called the citric acid cycle or the tricarboxylic acid (TCA) cycle. During the Krebs cycle, high-energy molecules, including ATP, NADH, and FADH2, are created. NADH and FADH2 then pass electrons through the electron transport chain in the mitochondria to generate more ATP molecules.
External Website
 Watch this animation to observe the Krebs cycle.
The three-carbon pyruvate molecule generated during glycolysis moves from the cytoplasm into the mitochondrial matrix, where it is converted by the enzyme pyruvate dehydrogenase into a two-carbon acetyl coenzyme A (acetyl CoA) molecule. This reaction is an oxidative decarboxylation reaction. It converts the three-carbon pyruvate into a two-carbon acetyl CoA molecule, releasing carbon dioxide and transferring two electrons that combine with NAD+ to form NADH. Acetyl CoA enters the Krebs cycle by combining with a four-carbon molecule, oxaloacetate, to form the six-carbon molecule citrate, or citric acid, at the same time releasing the coenzyme A molecule.
The six-carbon citrate molecule is systematically converted to a five-carbon molecule and then a four-carbon molecule, ending with oxaloacetate, the beginning of the cycle. Along the way, each citrate molecule will produce one ATP, one FADH2, and three NADH. The FADH2 and NADH will enter the oxidative phosphorylation system located in the inner mitochondrial membrane. In addition, the Krebs cycle supplies the starting materials to process and break down proteins and fats.
To start the Krebs cycle, citrate synthase combines acetyl CoA and oxaloacetate to form a six-carbon citrate molecule; CoA is subsequently released and can combine with another pyruvate molecule to begin the cycle again. The aconitase enzyme converts citrate into isocitrate. In two successive steps of oxidative decarboxylation, two molecules of CO2 and two NADH molecules are produced when isocitrate dehydrogenase converts isocitrate into the five-carbon α-ketoglutarate, which is then catalyzed and converted into the four-carbon succinyl CoA by α-ketoglutarate dehydrogenase. The enzyme succinyl CoA dehydrogenase then converts succinyl CoA into succinate and forms the high-energy molecule GTP, which transfers its energy to ADP to produce ATP. Succinate dehydrogenase then converts succinate into fumarate, forming a molecule of FADH2. Fumarase then converts fumarate into malate, which malate dehydrogenase then converts back into oxaloacetate while reducing NAD+ to NADH. Oxaloacetate is then ready to combine with the next acetyl CoA to start the Krebs cycle again (Figure 16.2.4). For each turn of the cycle, three NADH, one ATP (through GTP), and one FADH2 are created. Each carbon of pyruvate is converted into CO2, which is released as a byproduct of oxidative (aerobic) respiration.
Oxidative Phosphorylation and the Electron Transport Chain
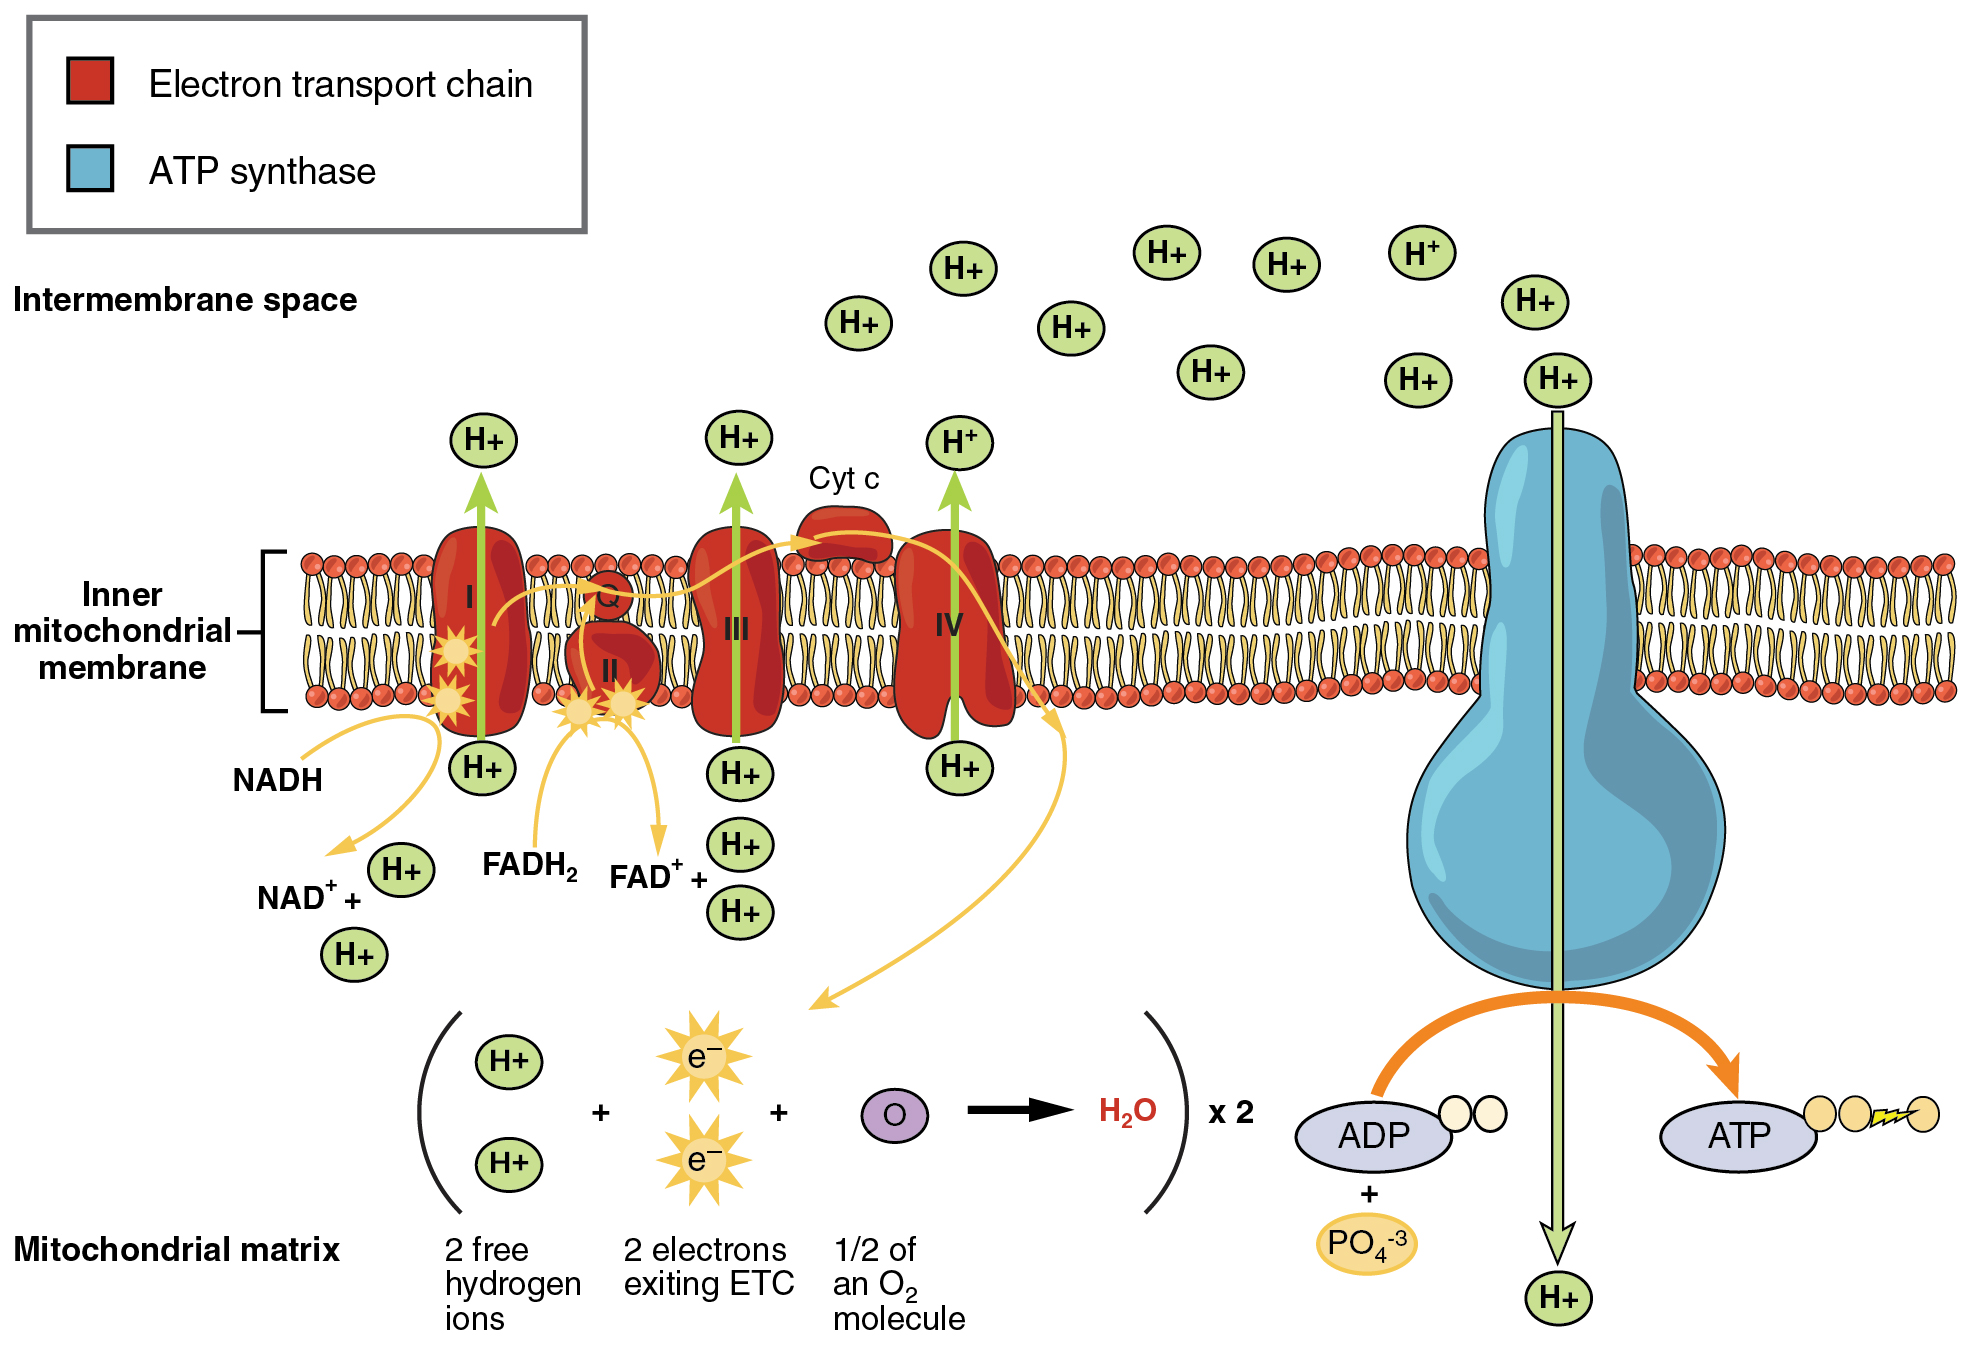
The electron transport chain (ETC) uses the NADH and FADH2 produced by the Krebs cycle to generate ATP. Electrons from NADH and FADH2 are transferred through protein complexes embedded in the inner mitochondrial membrane by a series of enzymatic reactions. The electron transport chain consists of a series of four enzyme complexes (Complex I – Complex IV) and two coenzymes (ubiquinone and Cytochrome c), which act as electron carriers and proton pumps used to transfer H+ ions into the space between the inner and outer mitochondrial membranes (Figure 16.2.5). The ETC couples the transfer of electrons between a donor (like NADH) and an electron acceptor (like O2) with the transfer of protons (H+ ions) across the inner mitochondrial membrane, enabling the process of oxidative phosphorylation. In the presence of oxygen, energy is passed, stepwise, through the electron carriers to collect gradually the energy needed to attach a phosphate to ADP and produce ATP. The role of molecular oxygen, O2, is as the terminal electron acceptor for the ETC. This means that once the electrons have passed through the entire ETC, they must be passed to another, separate molecule. These electrons, O2, and H+ ions from the matrix combine to form new water molecules. This is the basis for your need to breathe in oxygen. Without oxygen, electron flow through the ETC ceases.
External Website
 Watch this video to learn about the electron transport chain.
The electrons released from NADH and FADH2 are passed along the chain by each of the carriers, which are reduced when they receive the electron and oxidized when passing it on to the next carrier. Each of these reactions releases a small amount of energy, which is used to pump H+ ions across the inner membrane. The accumulation of these protons in the space between the membranes creates a proton gradient with respect to the mitochondrial matrix.
Also embedded in the inner mitochondrial membrane is an amazing protein pore complex called ATP synthase. Effectively, it is a turbine that is powered by the flow of H+ ions across the inner membrane down a gradient and into the mitochondrial matrix. As the H+ ions traverse the complex, the shaft of the complex rotates. This rotation enables other portions of ATP synthase to encourage ADP and Pi to create ATP. In accounting for the total number of ATP produced per glucose molecule through aerobic respiration, it is important to remember the following points:
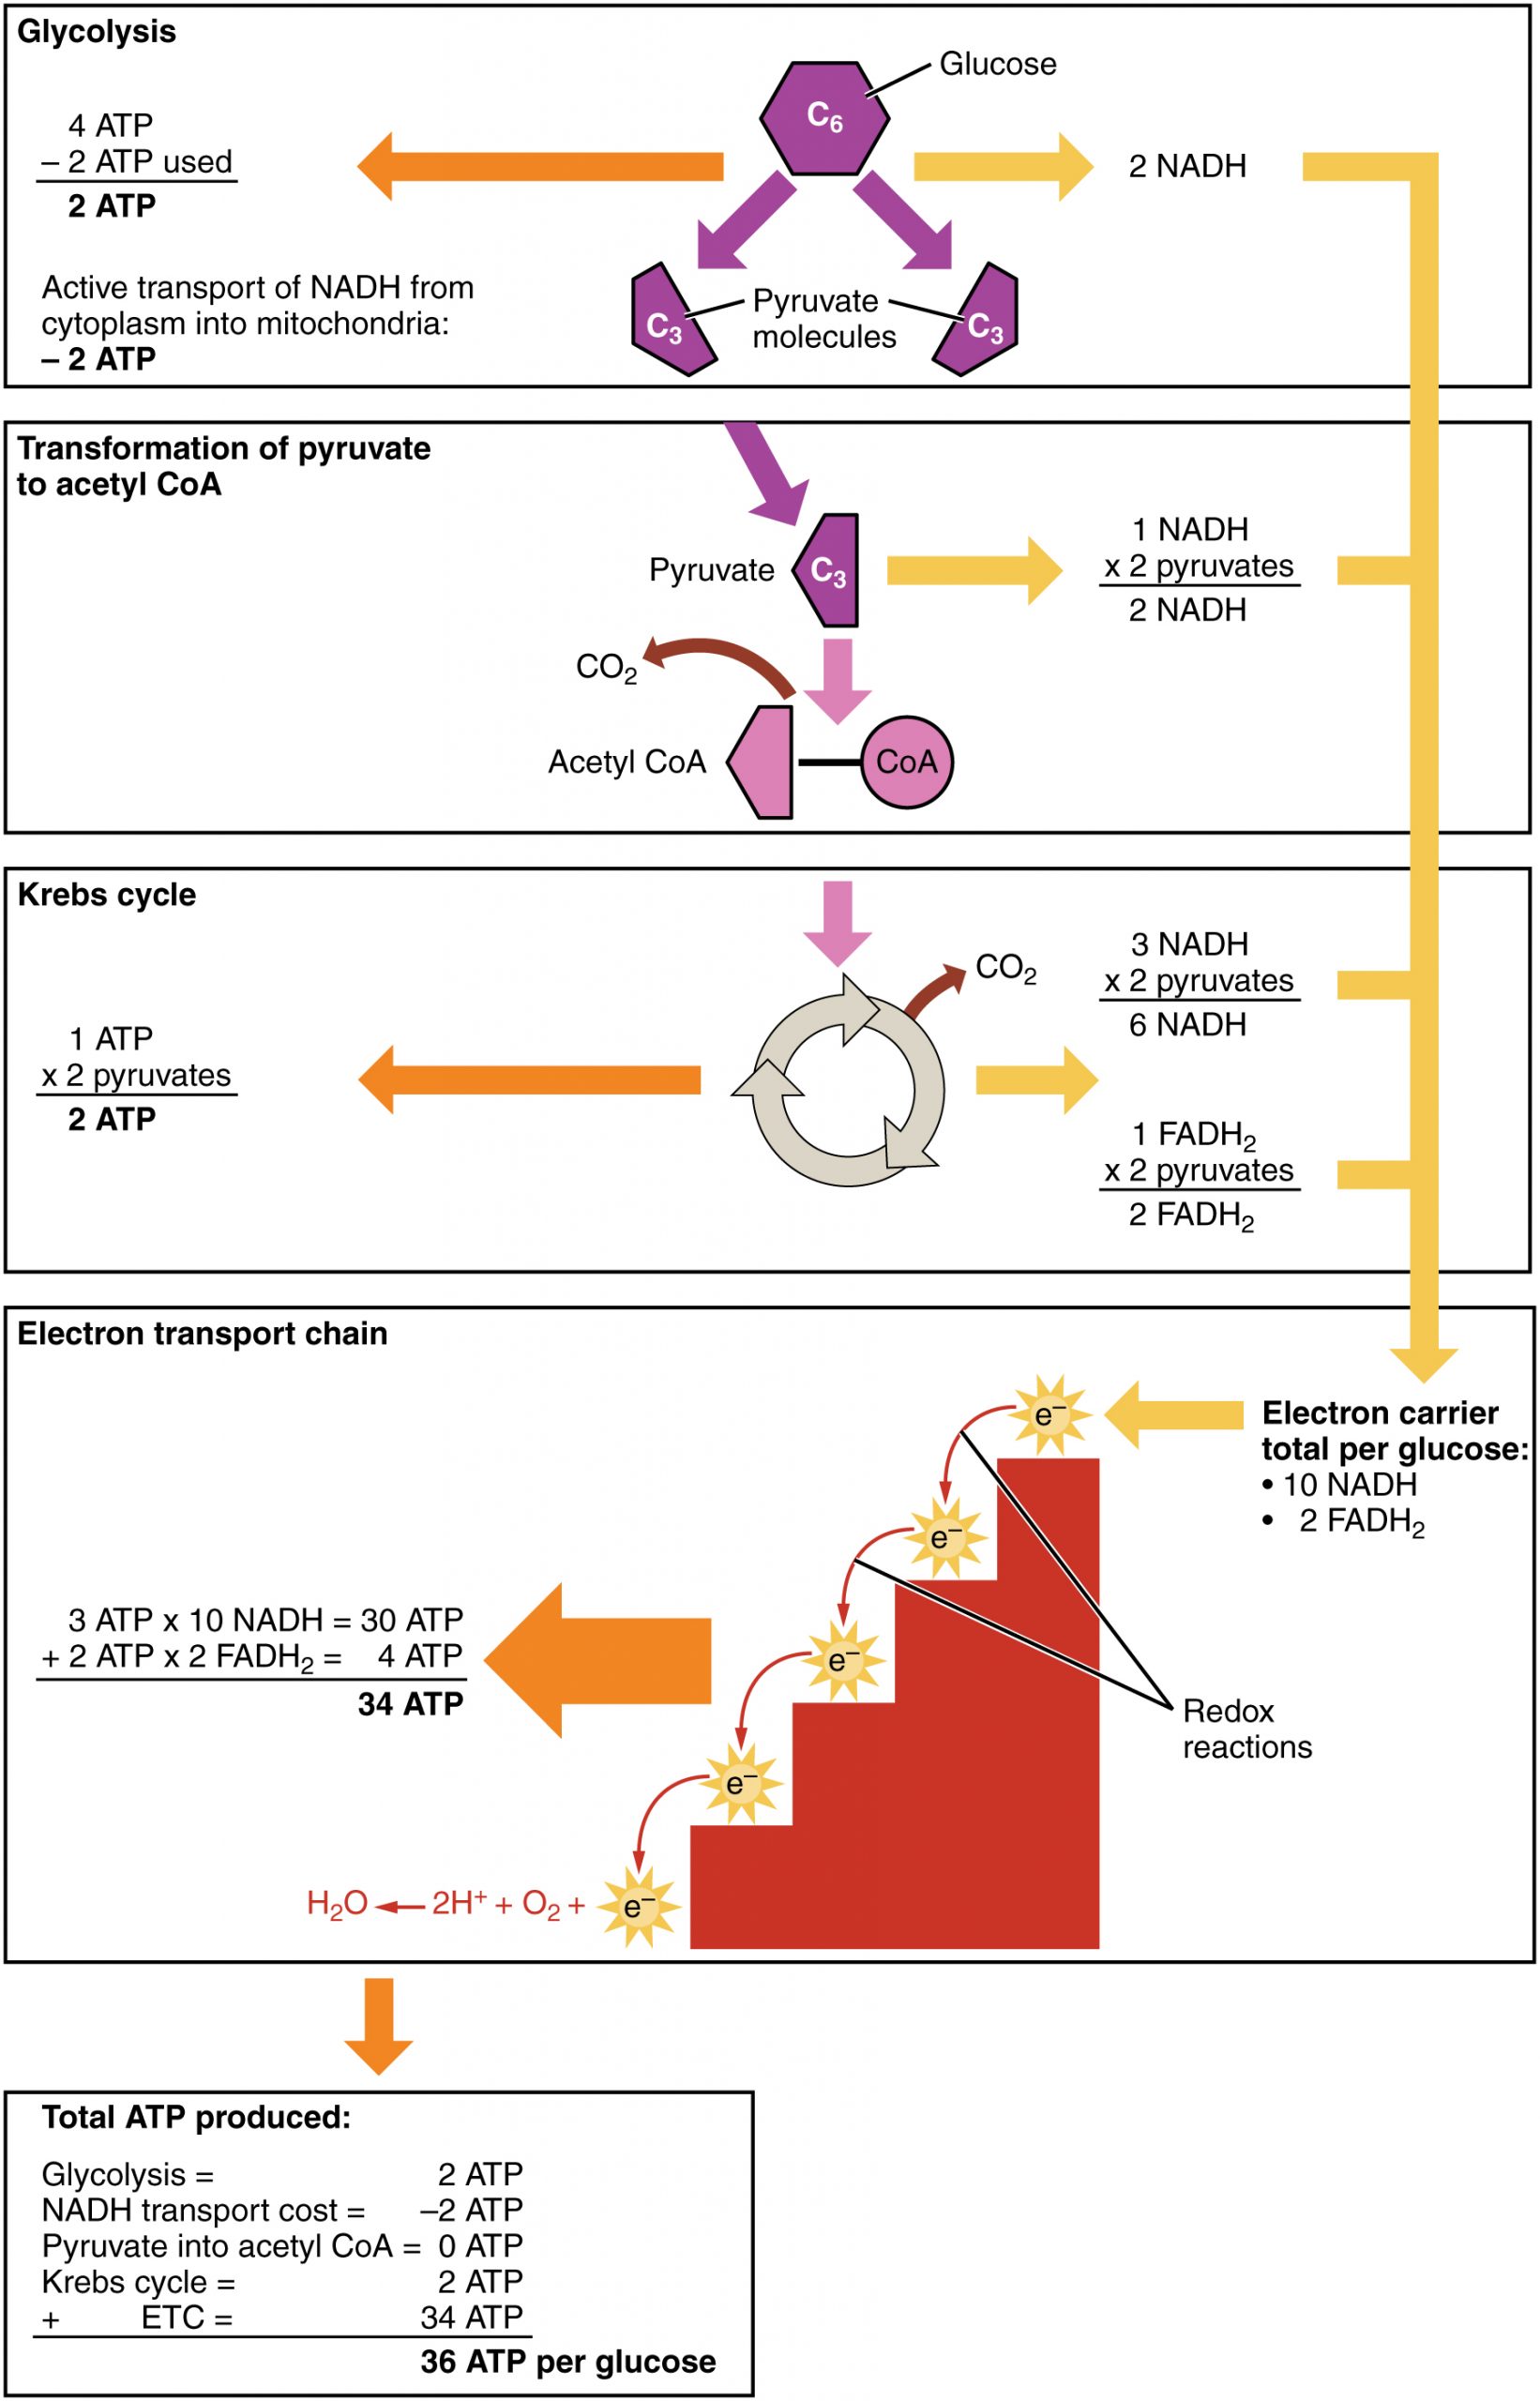
- A net of two ATP are produced through glycolysis (four produced and two consumed during the energy-consuming stage). However, these two ATP are used for transporting the NADH produced during glycolysis from the cytoplasm into the mitochondria. Therefore, the net production of ATP during glycolysis is zero.
- In all phases after glycolysis, the number of ATP, NADH, and FADH2 produced must be multiplied by two to reflect how each glucose molecule produces two pyruvate molecules.
- In the ETC, about three ATP are produced for every oxidized NADH. However, only about two ATP are produced for every oxidized FADH2. The electrons from FADH2 produce less ATP, because they start at a lower point in the ETC (Complex II) compared to the electrons from NADH (Complex I) (Figure 16.2.5).
Therefore, for every glucose molecule that enters aerobic respiration, a net total of 36 ATPs are produced (Figure 16.2.6).
Gluconeogenesis
Gluconeogenesis is the synthesis of new glucose molecules from pyruvate, lactate, glycerol, or the amino acids alanine or glutamine. This process takes place primarily in the liver during periods of low glucose, that is, under conditions of fasting, starvation, and low carbohydrate diets. So, the question can be raised as to why the body would create something it has just spent a fair amount of effort to break down? Certain key organs, including the brain, can use only glucose as an energy source; therefore, it is essential that the body maintain a minimum blood glucose concentration. When the blood glucose concentration falls below that certain point, new glucose is synthesized by the liver to raise the blood concentration to normal.
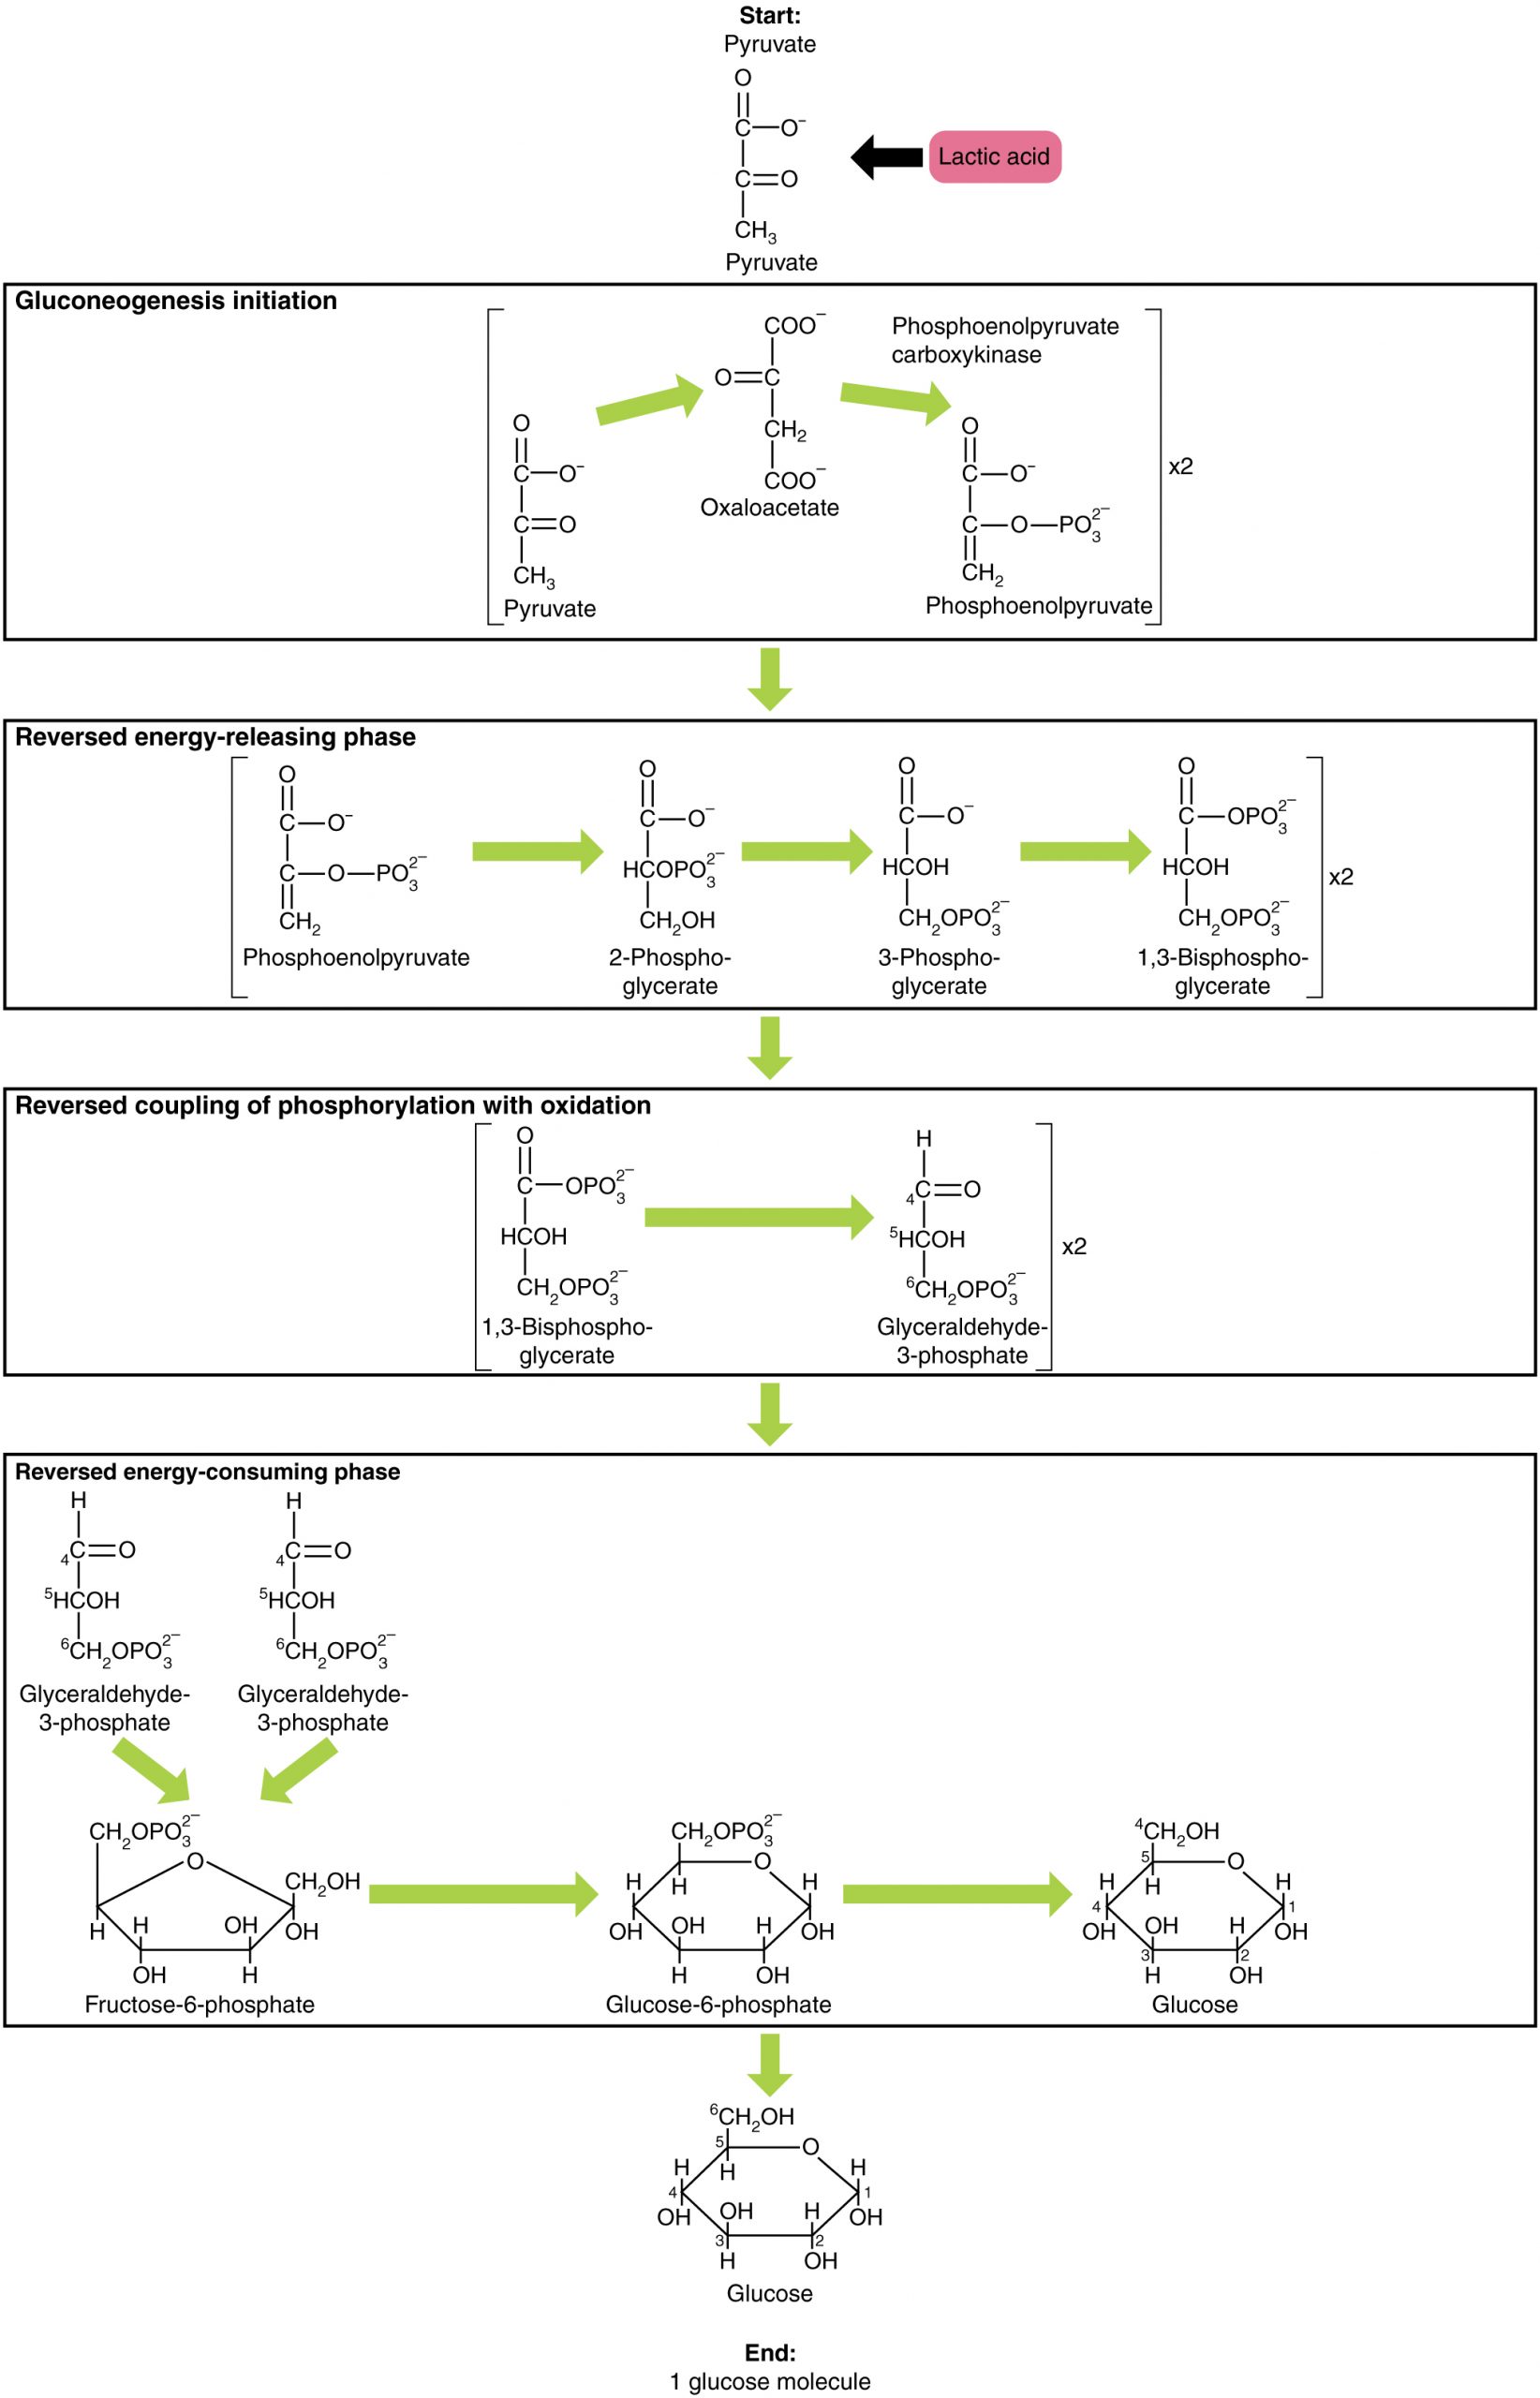
Gluconeogenesis is not simply the reverse of glycolysis. There are some important differences (Figure 16.2.7). Pyruvate is a common starting material for gluconeogenesis. First, the pyruvate is converted into oxaloacetate. Oxaloacetate then serves as a substrate for the enzyme phosphoenolpyruvate carboxykinase (PEPCK), which transforms oxaloacetate into phosphoenolpyruvate (PEP). From this step, gluconeogenesis is nearly the reverse of glycolysis. PEP is converted back into 2-phosphoglycerate, which is converted into 3-phosphoglycerate. Then, 3-phosphoglycerate is converted into 1,3 bisphosphoglycerate and then into glyceraldehyde-3-phosphate. Two molecules of glyceraldehyde-3-phosphate then combine to form fructose-1-6-bisphosphate, which is converted into fructose 6-phosphate and then into glucose-6-phosphate. Finally, a series of reactions generates glucose itself. In gluconeogenesis (as compared to glycolysis), the enzyme hexokinase is replaced by glucose-6-phosphatase, and the enzyme phosphofructokinase-1 is replaced by fructose-1,6-bisphosphatase. This helps the cell to regulate glycolysis and gluconeogenesis independently of each other.
As will be discussed as part of lipolysis, fats can be broken down into glycerol, which can be phosphorylated to form dihydroxyacetone phosphate or DHAP. DHAP can either enter the glycolytic pathway or be used by the liver as a substrate for gluconeogenesis.
Aging and the Body’s Metabolic Rate
The human body’s metabolic rate decreases nearly 2% per decade after age 30. Changes in body composition, including reduced lean muscle mass, are mostly responsible for this decrease. The most dramatic loss of muscle mass, and consequential decline in metabolic rate, occurs between 50 and 70 years of age. Loss of muscle mass is the equivalent of reduced strength, which tends to inhibit seniors from engaging in sufficient physical activity. This results in a positive-feedback system where the reduced physical activity leads to even more muscle loss, further reducing metabolism.
There are several things that can be done to help prevent general declines in metabolism and to fight back against the cyclic nature of these declines. These include eating breakfast, eating small meals frequently, consuming plenty of lean protein, drinking water to remain hydrated, exercising (including strength training), and getting enough sleep. These measures can help keep energy levels from dropping and curb the urge for increased calorie consumption from excessive snacking. While these strategies are not guaranteed to maintain metabolism, they do help prevent muscle loss and may increase energy levels. Some experts also suggest avoiding sugar, which can lead to excess fat storage. Spicy foods and green tea might also be beneficial. Because stress activates cortisol release, and cortisol slows metabolism, avoiding stress, or at least practicing relaxation techniques, can also help.
Section Review
Metabolic enzymes catalyze catabolic reactions that break down carbohydrates contained in food. The energy released is used to power the cells and systems that make up your body. Excess or unutilized energy is stored as fat or glycogen for later use. Carbohydrate metabolism begins in the mouth, where the enzyme salivary amylase begins to break down complex sugars into monosaccharides. These can then be transported across the intestinal membrane into the bloodstream and then to body tissues. In the cells, glucose, a six-carbon sugar, is processed through a sequence of reactions into smaller sugars, and the energy stored inside the molecule is released. The first step of carbohydrate catabolism is glycolysis, which produces pyruvate, NADH, and ATP. Under anaerobic conditions, the pyruvate can be converted into lactate to keep glycolysis working. Under aerobic conditions, pyruvate enters the Krebs cycle, also called the citric acid cycle or tricarboxylic acid cycle. In addition to ATP, the Krebs cycle produces high-energy FADH2 and NADH molecules, which provide electrons to the oxidative phosphorylation process that generates more high-energy ATP molecules. For each molecule of glucose that is processed in glycolysis, a net of 36 ATPs can be created by aerobic respiration.
Under anaerobic conditions, ATP production is limited to those generated by glycolysis. While a total of four ATPs are produced by glycolysis, two are needed to begin glycolysis, so there is a net yield of two ATP molecules.
In conditions of low glucose, such as fasting, starvation, or low carbohydrate diets, glucose can be synthesized from lactate, pyruvate, glycerol, alanine, or glutamate. This process, called gluconeogenesis, is almost the reverse of glycolysis and serves to create glucose molecules for glucose-dependent organs, such as the brain, when glucose levels fall below normal.
Review Questions
Critical Thinking Questions
Glossary
- acetyl coenzyme A (acetyl CoA)
- starting molecule of the Krebs cycle
- ATP synthase
- protein pore complex that creates ATP
- cellular respiration
- production of ATP from glucose oxidation via glycolysis, the Krebs cycle, and oxidative phosphorylation
- citric acid cycle
- also called the Krebs cycle or the tricarboxylic acid cycle; converts pyruvate into CO2 and high-energy FADH2, NADH, and ATP molecules
- electron transport chain (ETC)
- ATP production pathway in which electrons are passed through a series of oxidation-reduction reactions that forms water and produces a proton gradient
- energy-consuming phase
- first phase of glycolysis, in which two molecules of ATP are necessary to start the reaction
- energy-yielding phase
- second phase of glycolysis, during which energy is produced
- glucokinase
- cellular enzyme, found in the liver, which converts glucose into glucose-6-phosphate upon uptake into the cell
- gluconeogenesis
- process of glucose synthesis from pyruvate or other molecules
- glucose-6-phosphate
- phosphorylated glucose produced in the first step of glycolysis
- glycolysis
- series of metabolic reactions that breaks down glucose into pyruvate and produces ATP
- hexokinase
- cellular enzyme, found in most tissues, that converts glucose into glucose-6-phosphate upon uptake into the cell
- oxidative phosphorylation
- process that uses oxygen and converts high-energy NADH and FADH2 into ATP
- pyruvate
- three-carbon end product of glycolysis and starting material that is converted into acetyl CoA that enters the Krebs cycle
- terminal electron acceptor
- oxygen, the recipient of the free hydrogen at the end of the electron transport chain
Glossary Flashcards
This work, Human Physiology, is adapted from Anatomy & Physiology by OpenStax, licensed under CC BY. This edition, with revised content and artwork, is licensed under CC BY-SA except where otherwise noted.
Images from Anatomy & Physiology by OpenStax are licensed under CC BY except where otherwise noted.
Access the original for free at OpenStax.
Image Descriptions
Figure 16.2.1. This diagram illustrates the four major stages of cellular respiration and their locations within the cell. The top section shows glycolysis occurring in the cytoplasm, where one glucose molecule (C₆) is broken down into two pyruvate molecules (C₃), producing ATP. The second section depicts the transformation of pyruvate into acetyl CoA in the mitochondrial matrix, with carbon dioxide (CO₂) released as a byproduct. The third section illustrates the Krebs cycle, also occurring in the mitochondrial matrix, shown as a circular pathway that produces additional CO₂ and ATP. The bottom section details oxidative phosphorylation taking place along the mitochondrial inner membrane, represented by a descending red staircase structure. This shows electrons removed from glucose, pyruvate, and acetyl CoA being passed through a series of redox reactions, with each step producing ATP molecules. At the bottom of the electron transport chain, the equation H₂O ← 2H⁺ + O₂ + e⁻ indicates the final step where oxygen accepts electrons to form water. Yellow arrows throughout the diagram track the flow of electrons and energy, while orange arrows indicate ATP production at various stages. [Return to Figure 16.2.1]
Figure 16.2.2. This diagram illustrates the glycolytic pathway, which breaks down one glucose molecule (C₆) into two pyruvate molecules (C₃) through three distinct phases. The process begins with a single glucose molecule at the top. Phase 1, labeled “Energy-consuming phase,” shows the initial investment of 2 ATP molecules that are converted to ADP as phosphate groups are added to the glucose molecule, splitting it into two three-carbon intermediates. Phase 2, titled “Coupling of phosphorylation with oxidation,” depicts exergonic and endergonic reactions occurring simultaneously on both molecular branches. During this phase, electrons are transferred (shown with “e⁻” symbols) to produce 2 NADH molecules from NAD⁺, while free phosphate groups are incorporated into the molecules. Phase 3, the “Energy-releasing phase,” shows the production of 4 ATP molecules (2 per branch) as ADP molecules gain phosphate groups, indicated by orange and green arrows. The pathway concludes with two pyruvate molecules (C₃) at the bottom. Throughout the diagram, purple arrows track the main metabolic flow, orange arrows indicate ATP synthesis, and teal/green arrows show the ATP-ADP interconversion. The net result is a gain of 2 ATP molecules and 2 NADH molecules per glucose molecule processed. [Return to Figure 16.2.2]
Figure 16.2.3. This comprehensive diagram illustrates the complete pathways of both aerobic and anaerobic cellular respiration, beginning with one glucose molecule (C₆) at the top. Both pathways start with an identical energy-consuming phase where 2 ATP molecules are consumed to split glucose into two three-carbon molecules (C₃). The diagram then branches based on oxygen availability. The left side shows aerobic respiration (when O₂ is present), which proceeds through coupling of phosphorylation with oxidation to produce 2 NADH molecules, followed by an energy-releasing phase generating 4 ATPs. The two resulting pyruvate molecules are then transformed into acetyl CoA, releasing CO₂, and enter the Krebs cycle producing additional ATP and CO₂. NADH molecules shuttle electrons to the electron transport chain, depicted as a red descending staircase, where oxygen serves as the final electron acceptor to form water (H₂O ← 2H⁺ + O₂ + e⁻), ultimately producing approximately 36 ATP molecules per glucose. The right side shows anaerobic respiration (when O₂ is absent), which follows similar initial steps through the energy-releasing phase but then converts pyruvate to lactate. Chemical equations show NADH being oxidized by pyruvate to form lactate, with the structural formulas displaying the addition of hydrogen (H) and hydroxyl (OH) groups. This anaerobic pathway yields only 2 net ATPs per glucose molecule. Yellow connecting lines trace the flow of NADH and energy through both pathways, highlighting the dramatic difference in ATP production between aerobic and anaerobic respiration. [Return to Figure 16.2.3]
Figure 16.2.4. This diagram illustrates two key stages of cellular respiration: the transformation of pyruvate into acetyl CoA and the complete Krebs cycle (also called the citric acid cycle). The top section shows pyruvate, a three-carbon molecule with the chemical structure showing carboxyl (COO⁻), carbonyl (C=O), and methyl (CH₃) groups, undergoing oxidative decarboxylation. During this process, carbon dioxide (CO₂) is released, and a two-carbon fragment (intermediary) is formed. Coenzyme A (S-CoA) is then added to create acetyl CoA, while NAD⁺ is reduced to NADH for use in the electron transport chain. The bottom section depicts the Krebs cycle as a circular pathway with eight major steps, showing the chemical structures of all intermediates. Starting with acetyl CoA (C₂) combining with oxaloacetate (C₄) to form citrate (C₆), the cycle proceeds clockwise through isocitrate, α-ketoglutarate (C₅), succinyl CoA (C₄), succinate, fumarate, malate, and back to oxaloacetate. Throughout the cycle, several key events occur: two CO₂ molecules are released (at isocitrate and α-ketoglutarate steps), three NADH molecules are produced (from NAD⁺), one FADH₂ is generated (from FAD), and one GTP/ATP is synthesized (from GDP/ADP with inorganic phosphate, PO₄³⁻). Yellow and orange highlighting on certain carbon atoms tracks the fate of specific carbons through the cycle, while pink arrows in the upper section and gray arrows in the cycle indicate the direction of reactions. [Return to Figure 16.2.4]
Figure 16.2.5. This diagram illustrates the process of oxidative phosphorylation occurring across the inner mitochondrial membrane, showing both the electron transport chain (marked in red) and ATP synthase (marked in blue). The membrane is depicted as a phospholipid bilayer separating the intermembrane space above from the mitochondrial matrix below. The electron transport chain consists of several large protein complexes embedded in the membrane, including cytochrome c (Cyt c), through which electrons from NADH and FADH₂ pass. As electrons move through these complexes, shown by yellow arrows and sunburst symbols, hydrogen ions (H⁺) are actively pumped from the mitochondrial matrix into the intermembrane space, creating a high concentration of protons above the membrane. The diagram shows multiple green circles labeled H⁺ accumulating in the intermembrane space. On the right side, ATP synthase is depicted as a large blue mushroom-shaped enzyme spanning the membrane, with a channel through which protons flow back down their concentration gradient. At the bottom of the diagram, a chemical equation shows that 2 free hydrogen ions plus 2 electrons exiting the electron transport chain (ETC) combine with half an oxygen molecule to form water (H₂O), with this entire reaction occurring twice. The proton flow through ATP synthase drives the phosphorylation of ADP (shown with inorganic phosphate, PO₄³⁻) to produce ATP, illustrated by an orange arrow converting ADP to ATP with its characteristic three phosphate groups. [Return to Figure 16.2.5]
Figure 16.2.6. This comprehensive diagram traces the complete energy yield from one glucose molecule through all stages of cellular respiration, with detailed ATP accounting at each step. The diagram is divided into five sections arranged vertically. The first section shows glycolysis, where one glucose molecule (C₆) is split into two pyruvate molecules (C₃), producing 4 ATP but consuming 2 ATP for a net gain of 2 ATP, while also generating 2 NADH molecules. An additional cost of 2 ATP is noted for active transport of NADH from the cytoplasm into the mitochondria. The second section depicts the transformation of pyruvate to acetyl CoA, where each pyruvate loses CO₂ and combines with coenzyme A (CoA), producing 1 NADH per pyruvate, or 2 NADH total for both pyruvates. The third section illustrates the Krebs cycle as a circular pathway, which processes both acetyl CoA molecules to produce 1 ATP per pyruvate (2 ATP total), releases CO₂, and generates 3 NADH per pyruvate (6 NADH total) plus 1 FADH₂ per pyruvate (2 FADH₂ total). The fourth section shows the electron transport chain as a red descending staircase with four steps, where electrons (e⁻) from NADH and FADH₂ participate in redox reactions. The total electron carriers per glucose are listed as 10 NADH and 2 FADH₂. At the bottom of the staircase, the equation H₂O ← 2H⁺ + O₂ + e⁻ shows water formation. The calculation shows that 10 NADH molecules produce 30 ATP (3 ATP per NADH) and 2 FADH₂ molecules produce 4 ATP (2 ATP per FADH₂), yielding 34 ATP from the electron transport chain. Yellow arrows throughout the diagram track the flow of NADH and FADH₂ from their production through to the electron transport chain, while orange arrows indicate ATP production. The final section at the bottom provides a complete accounting showing that glycolysis yields 2 ATP, NADH transport costs 2 ATP, pyruvate to acetyl CoA conversion yields 0 ATP, the Krebs cycle produces 2 ATP, and the electron transport chain generates 34 ATP, for a grand total of 36 ATP per glucose molecule. [Return to Figure 16.2.6]
Figure 16.2.7. This detailed biochemical diagram illustrates the process of gluconeogenesis, the metabolic pathway that synthesizes glucose from non-carbohydrate precursors. At the top, the pathway can begin with either pyruvate or lactic acid as the starting substrate, with their chemical structures shown. The diagram is organized into four sequential phases, each contained in a labeled box connected by green arrows indicating the direction of reactions. The first phase, “Gluconeogenesis initiation,” shows pyruvate being converted to oxaloacetate and then to phosphoenolpyruvate through the action of phosphoenolpyruvate carboxykinase, with all chemical structures and formulas displayed. The notation “x2” indicates that two molecules proceed through this pathway. The second phase, “Reversed energy-releasing phase,” depicts the conversion of phosphoenolpyruvate through a series of intermediates: 2-phosphoglycerate, 3-phosphoglycerate, and 1,3-bisphosphoglycerate, with each structure showing the phosphate group attachments (OPO₃²⁻). The third phase, “Reversed coupling of phosphorylation with oxidation,” shows the transformation of 1,3-bisphosphoglycerate to glyceraldehyde-3-phosphate, with detailed molecular structures including the aldehyde group (C=O). The fourth and final phase, “Reversed energy-consuming phase,” illustrates how two molecules of glyceraldehyde-3-phosphate are converted first to fructose-6-phosphate, then to glucose-6-phosphate, and finally to free glucose. The complete molecular structures are shown for each sugar, including all carbon atoms, hydroxyl groups (OH), and the ring structures characteristic of these hexose sugars. At the bottom, the final product is a single glucose molecule, with its complete structural formula displayed showing the six-carbon ring with hydroxyl groups at specific positions. Throughout the diagram, green arrows connect each step, emphasizing that this pathway essentially reverses several steps of glycolysis to build glucose from simpler precursors. [Return to Figure 16.2.7]
Report an Error
Did you find an error, typo, broken link, or other problem in the text? Please follow this link to the error reporting form to submit an error report to the authors.