Chapter 16. Metabolism and Nutrition
16.3 Lipid Metabolism
Learning Objectives
By the end of this section, you will be able to:
- Describe how the body digests lipids
- Describe how, when, and why the body metabolizes lipids
- Explain how energy can be derived from fat
- Explain the purpose and process of ketogenesis
- Describe the process of ketone body oxidation
- Explain the purpose and the process of lipogenesis
Fats (or triglycerides) within the body are ingested as food or synthesized by adipocytes or hepatocytes from carbohydrate precursors (Figure 16.3.1). Lipid metabolism entails the oxidation of fatty acids to either generate energy or synthesize new lipids from smaller constituent molecules. Lipid metabolism is associated with carbohydrate metabolism, as products of glucose (such as acetyl CoA) can be converted into lipids.
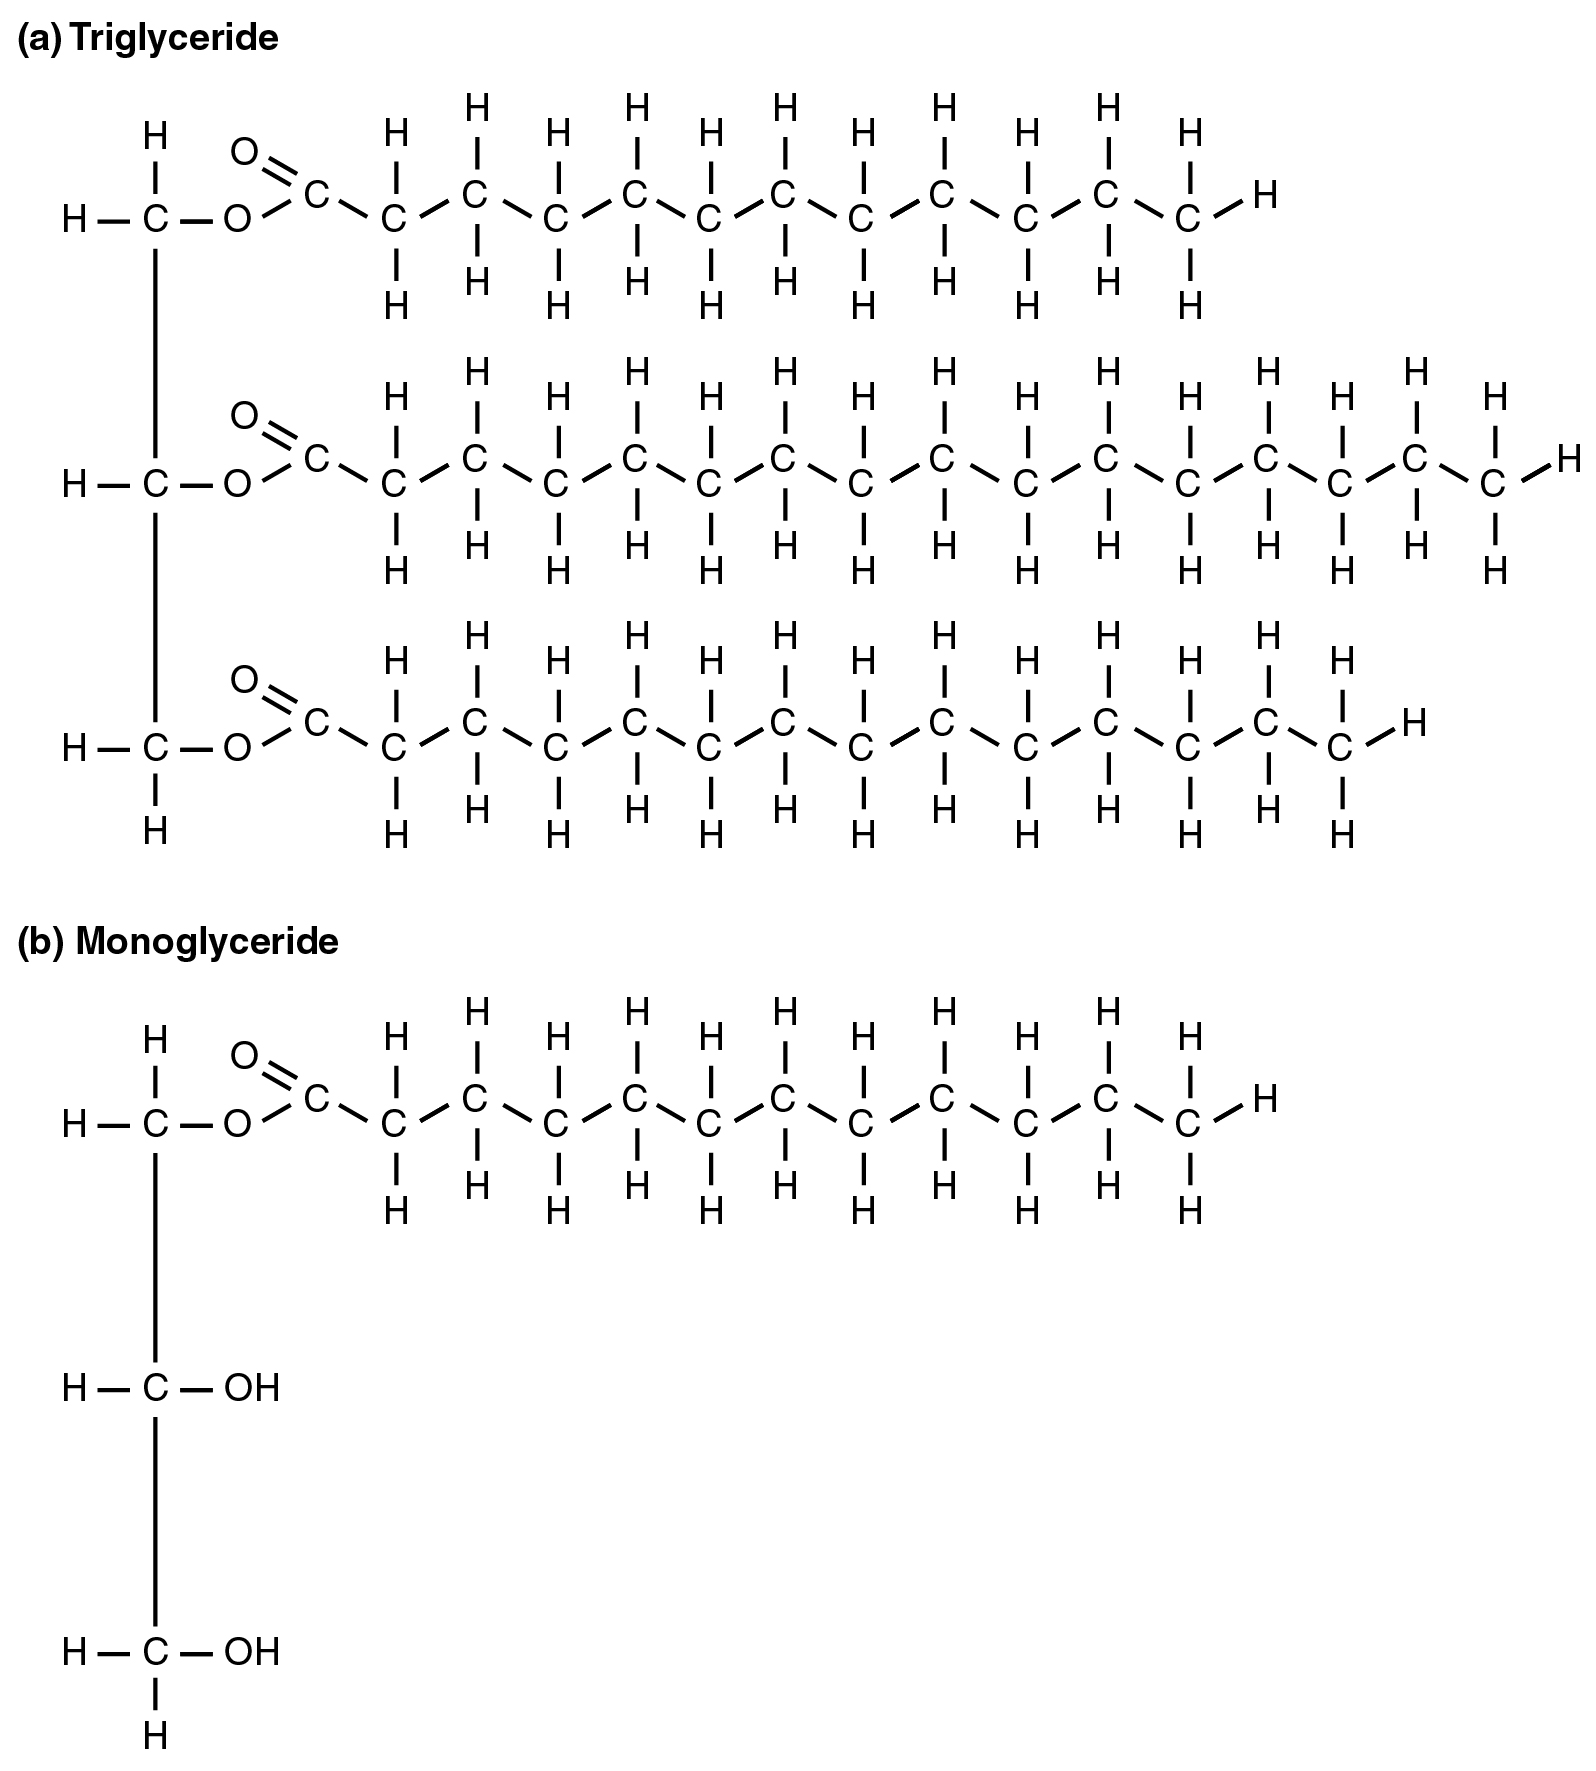
Lipid metabolism begins in the intestine where ingested triglycerides are broken down into free fatty acids and a monoglyceride molecule (Figure 16.3.1b) by pancreatic lipases, enzymes that break down fats after they are emulsified by bile salts. When food reaches the small intestine in the form of chyme, a digestive hormone called cholecystokinin (CCK) is released by intestinal cells in the intestinal mucosa. CCK stimulates the release of pancreatic lipase from the pancreas and stimulates the contraction of the gallbladder to release stored bile salts into the intestine. CCK also travels to the brain, where it can act as a hunger suppressant.
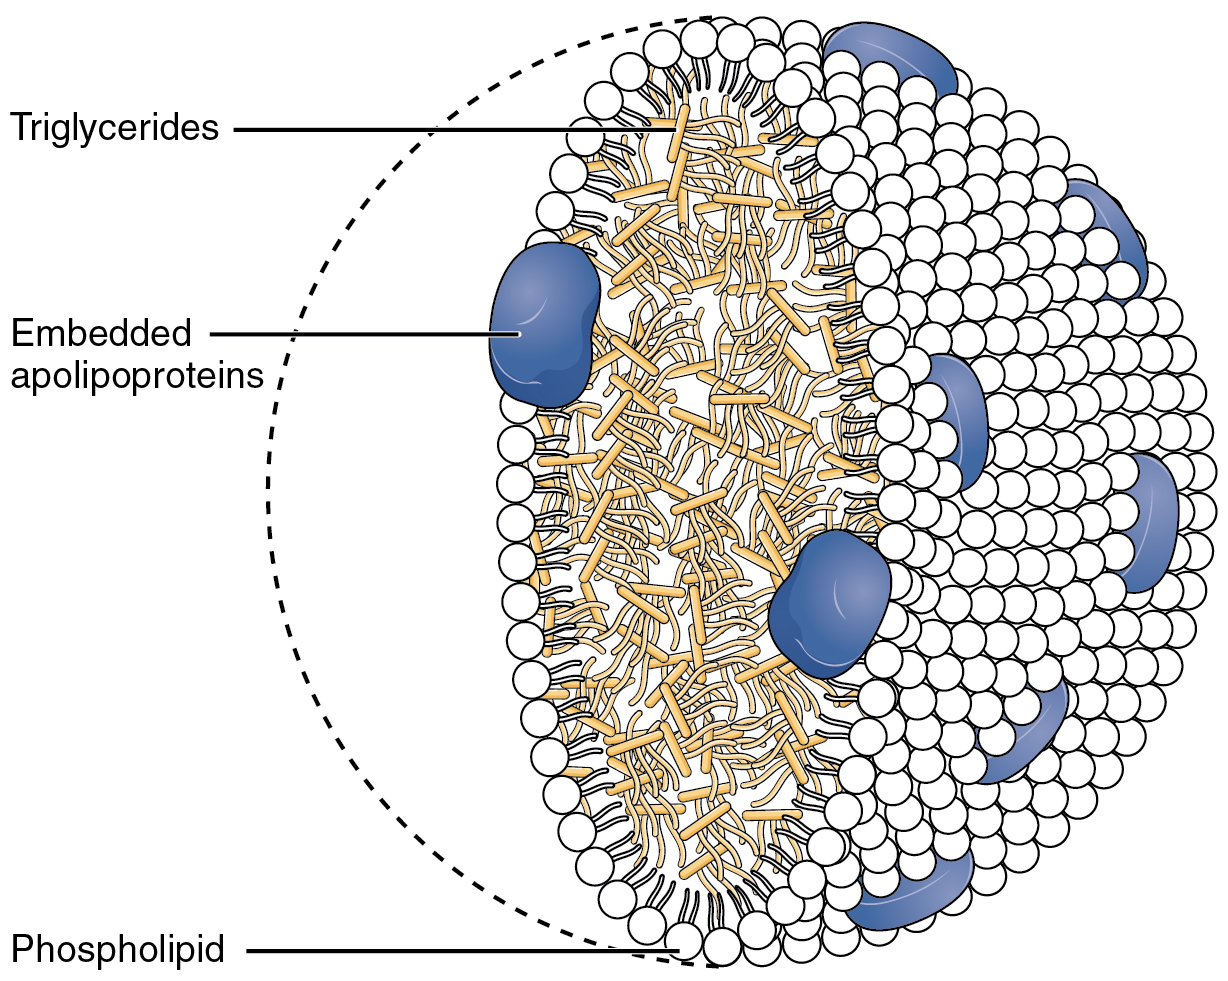
Once the bile salts have emulsified the triglycerides, the pancreatic lipases down triglycerides into free fatty acids. These fatty acids can be transported across the intestinal membrane. However, once they cross the membrane, they are recombined to again form triglyceride molecules. Within the intestinal cells, these triglycerides are packaged along with cholesterol molecules in phospholipid vesicles called chylomicrons (Figure 16.3.2). The chylomicrons enable fats and cholesterol to move within the aqueous environment of your lymphatic and circulatory systems. Chylomicrons leave the enterocytes by exocytosis and enter the lymphatic system via lacteals in the villi of the intestine. From the lymphatic system, the chylomicrons are transported to the circulatory system. Once in the circulation, they can either go to the liver or be stored in fat cells (adipocytes) that comprise adipose (fat) tissue found throughout the body.
Lipolysis
To obtain energy from fat, triglycerides must first be broken down by hydrolysis into their two principal components, fatty acids and glycerol. This process, called lipolysis, takes place in the cytoplasm. The resulting fatty acids are oxidized by β-oxidation into acetyl CoA, which is used by the Krebs cycle. The glycerol that is released from triglycerides after lipolysis directly enters the glycolysis pathway as DHAP. Because one triglyceride molecule yields three fatty acid molecules with as much as 16 or more carbons in each one, fat molecules yield more energy than carbohydrates and are an important source of energy for the human body. Triglycerides yield more than twice the energy per unit mass when compared to carbohydrates and proteins. Therefore, when glucose levels are low, triglycerides can be converted into acetyl CoA molecules and used to generate adenosine triphosphate (ATP) through aerobic respiration.
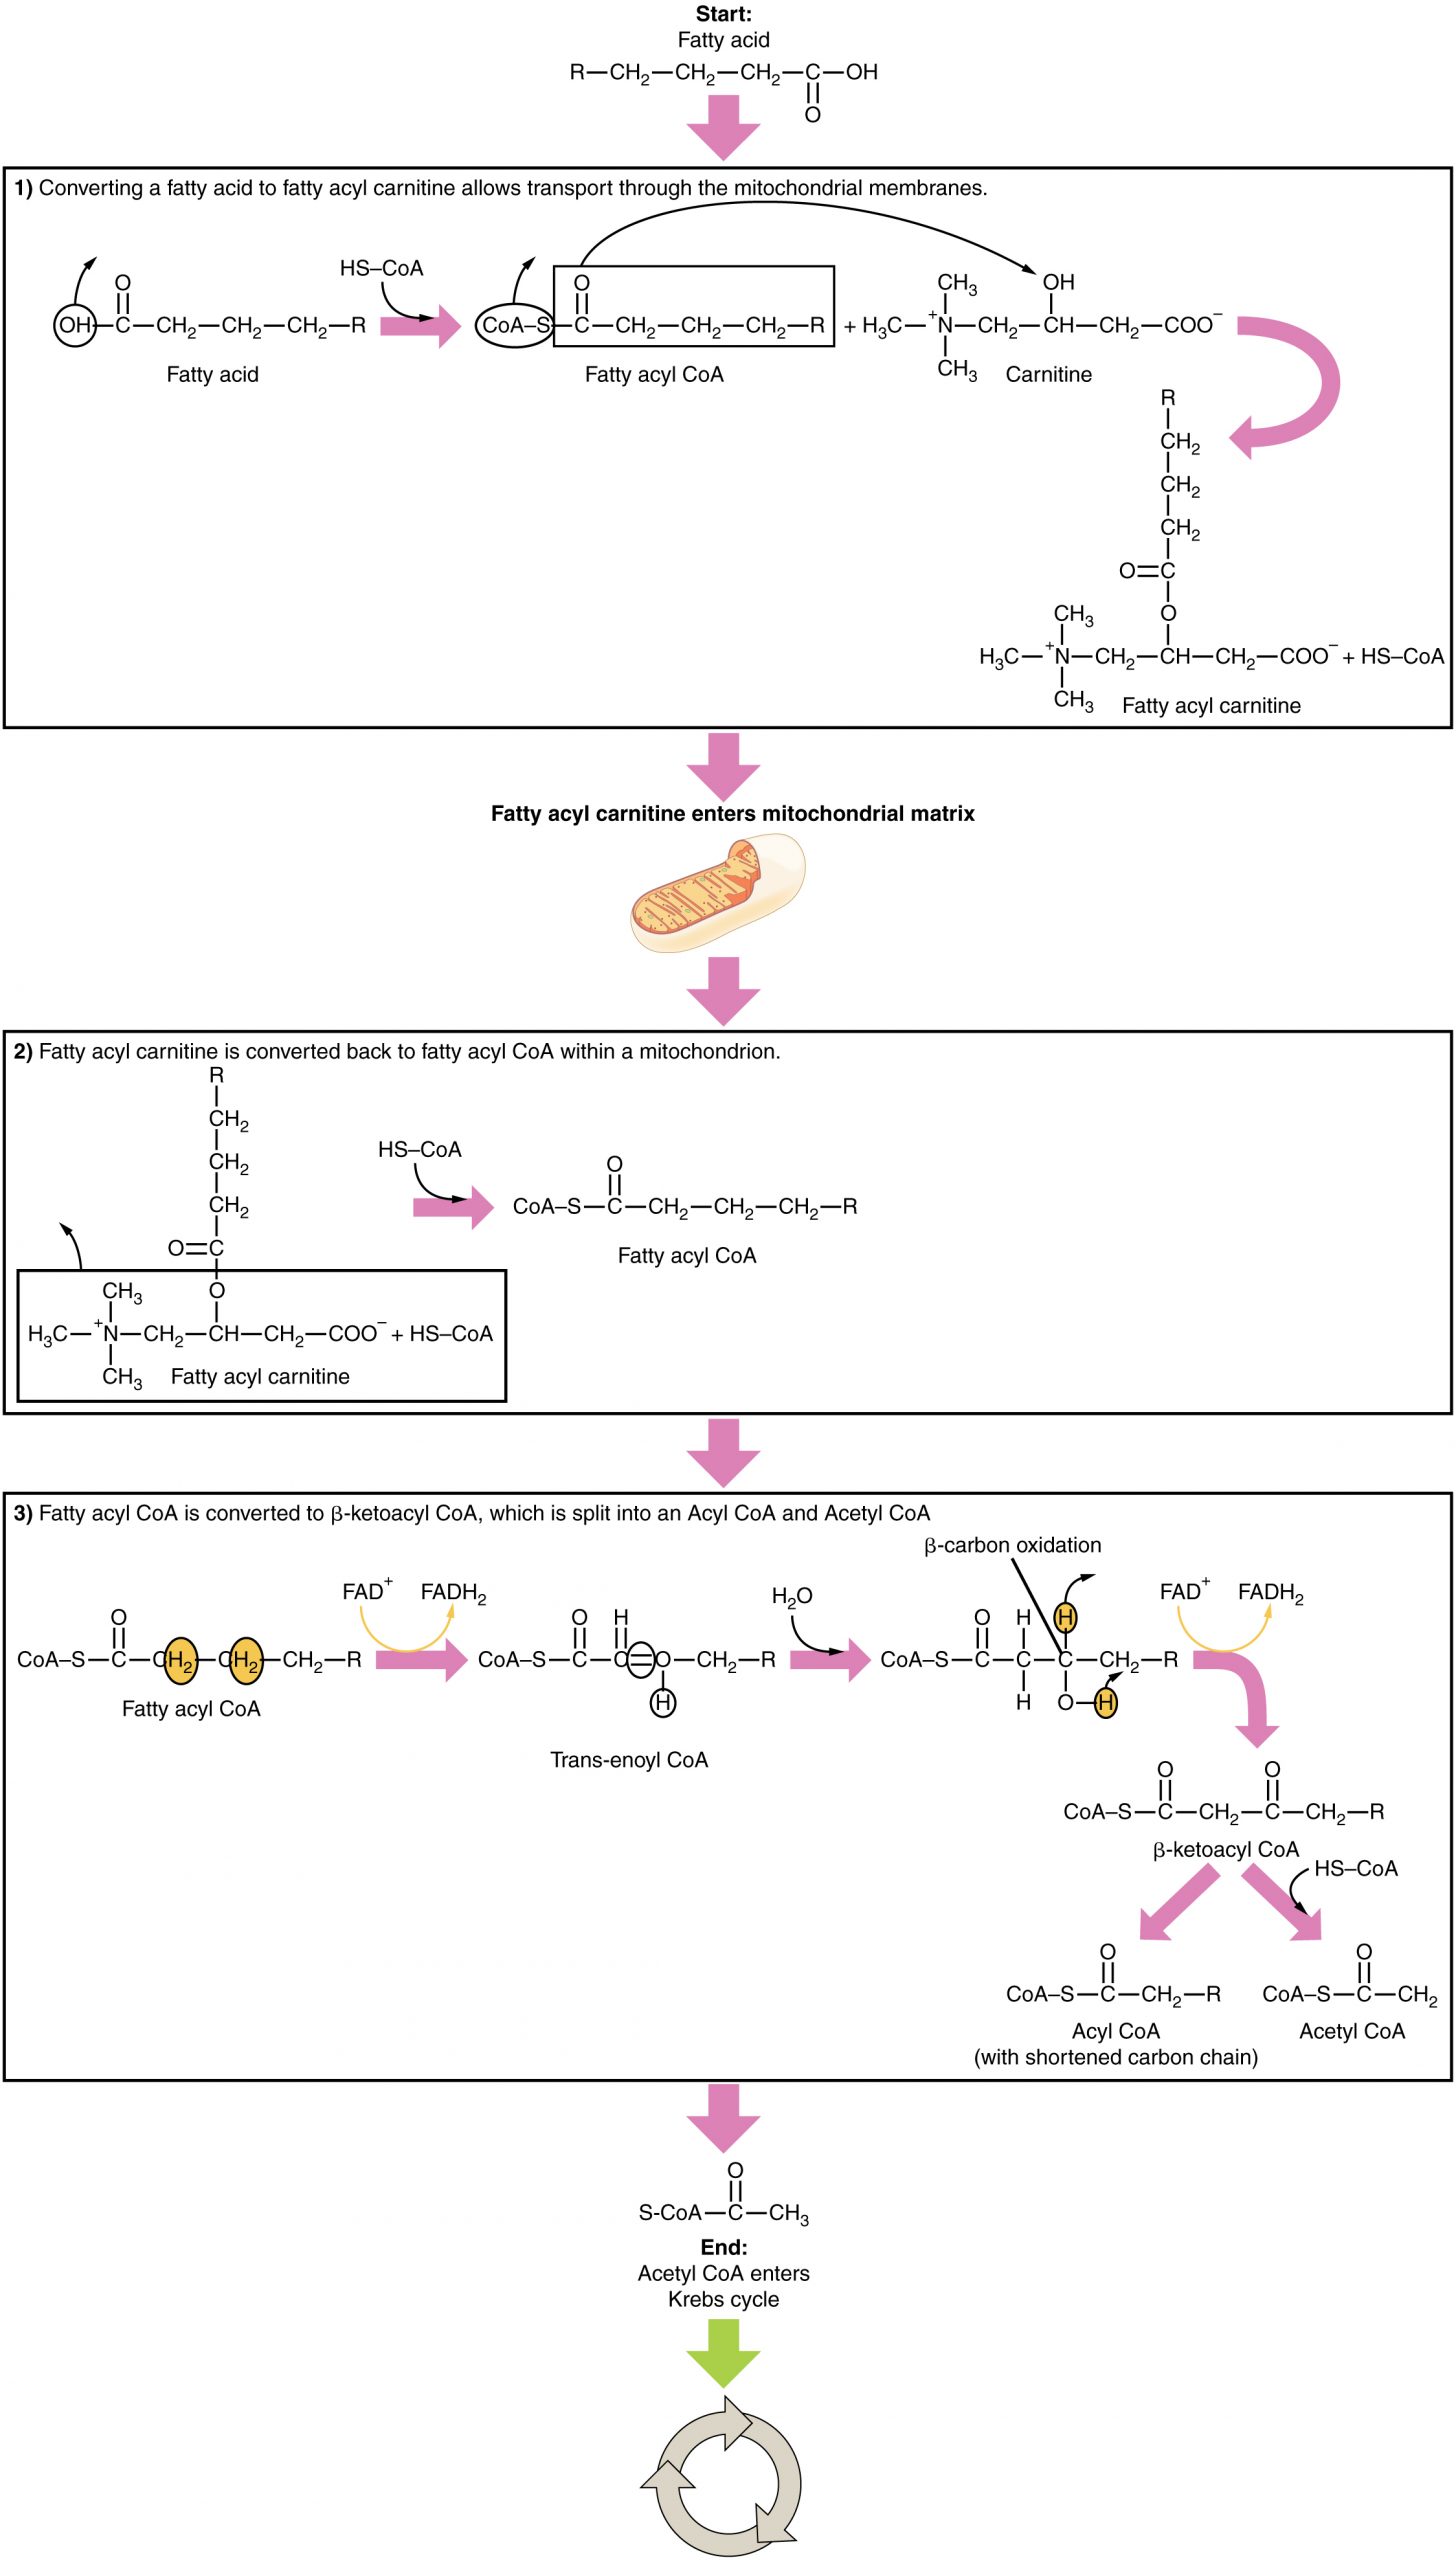
The breakdown of fatty acids, called fatty acid oxidation or beta (β)-oxidation, begins in the cytoplasm, where fatty acids are converted into fatty acyl CoA molecules. This fatty acyl CoA combines with carnitine to create a fatty acyl carnitine molecule, which helps to transport the fatty acid across the mitochondrial membrane. Once inside the mitochondrial matrix, the fatty acyl carnitine molecule is converted back into fatty acyl CoA and then into acetyl CoA (Figure 16.3.3). The newly formed acetyl CoA enters the Krebs cycle and is used to produce ATP in the same way as acetyl CoA derived from pyruvate.
Ketogenesis
If excessive acetyl CoA is created from the oxidation of fatty acids and the Krebs cycle is overloaded and cannot handle it, the acetyl CoA is diverted to create ketone bodies. These ketone bodies can serve as a fuel source if glucose levels are too low in the body. Ketones serve as fuel in times of prolonged starvation or when patients suffer from uncontrolled diabetes and cannot utilize most of the circulating glucose. In both cases, fat stores are liberated to generate energy through the Krebs cycle and will generate ketone bodies when too much acetyl CoA accumulates.
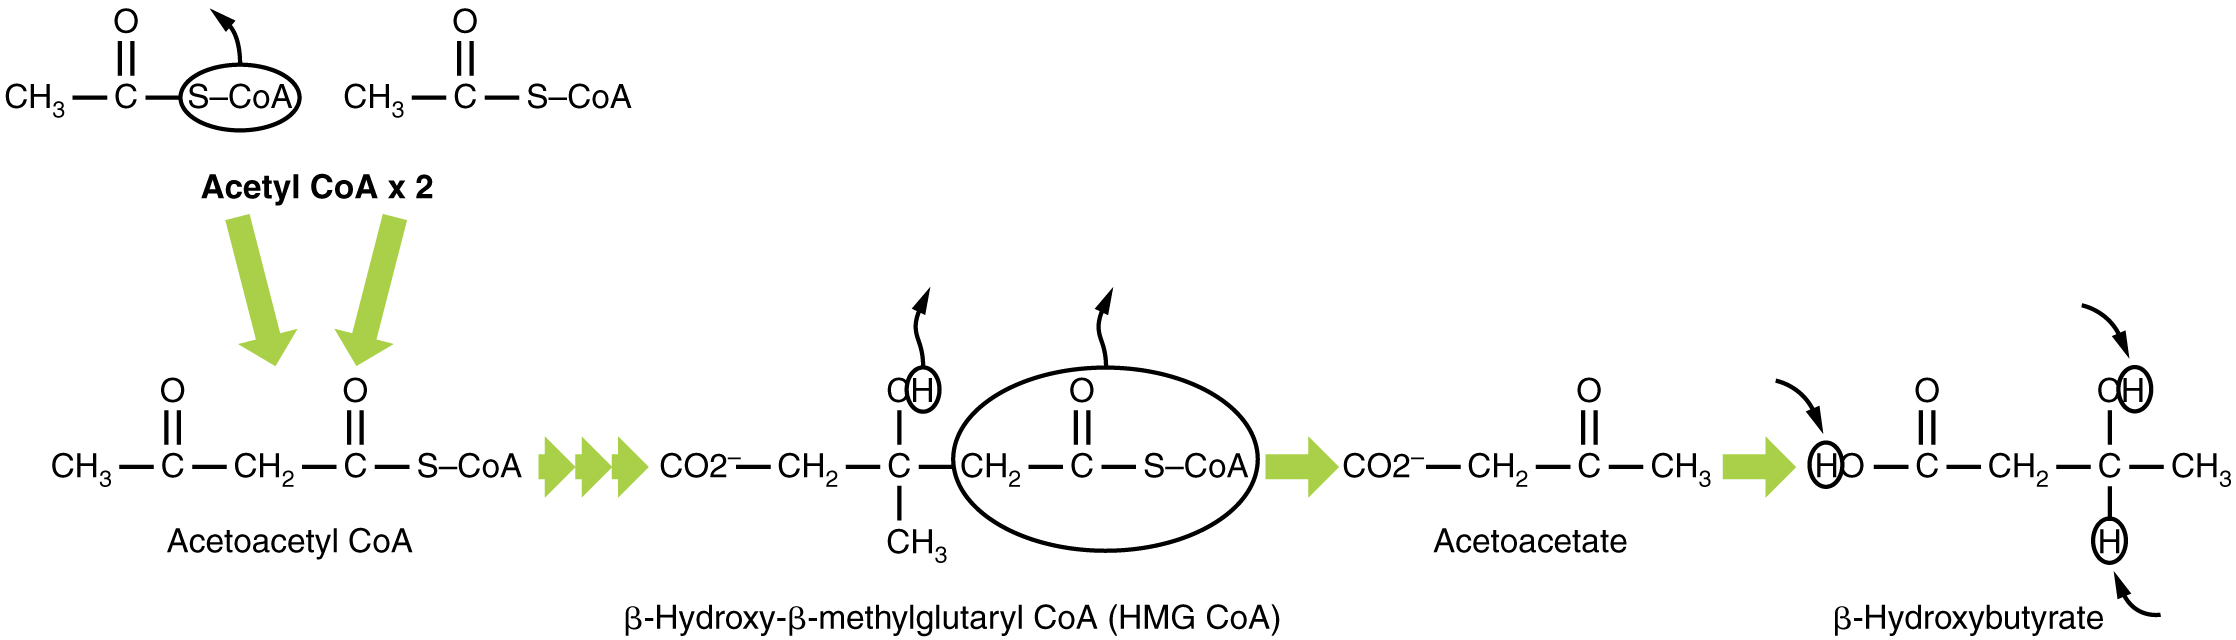
In this ketone synthesis reaction, excess acetyl CoA is converted into hydroxymethylglutaryl CoA (HMG CoA). HMG CoA is a precursor of cholesterol and is an intermediate that is subsequently converted into β-hydroxybutyrate, the primary ketone body in the blood (Figure 16.3.4).
Ketone Body Oxidation
Organs that have classically been thought to be dependent solely on glucose, such as the brain, can actually use ketones as an alternative energy source. This keeps the brain functioning when glucose is limited. When ketones are produced faster than they can be used, they can be broken down into CO2 and acetone. The acetone is removed by exhalation. One symptom of ketogenesis is that the patient’s breath smells sweet like alcohol. This effect provides one way of telling if a diabetic is properly controlling the disease. The carbon dioxide produced can acidify the blood, leading to diabetic ketoacidosis, a dangerous condition in diabetics.
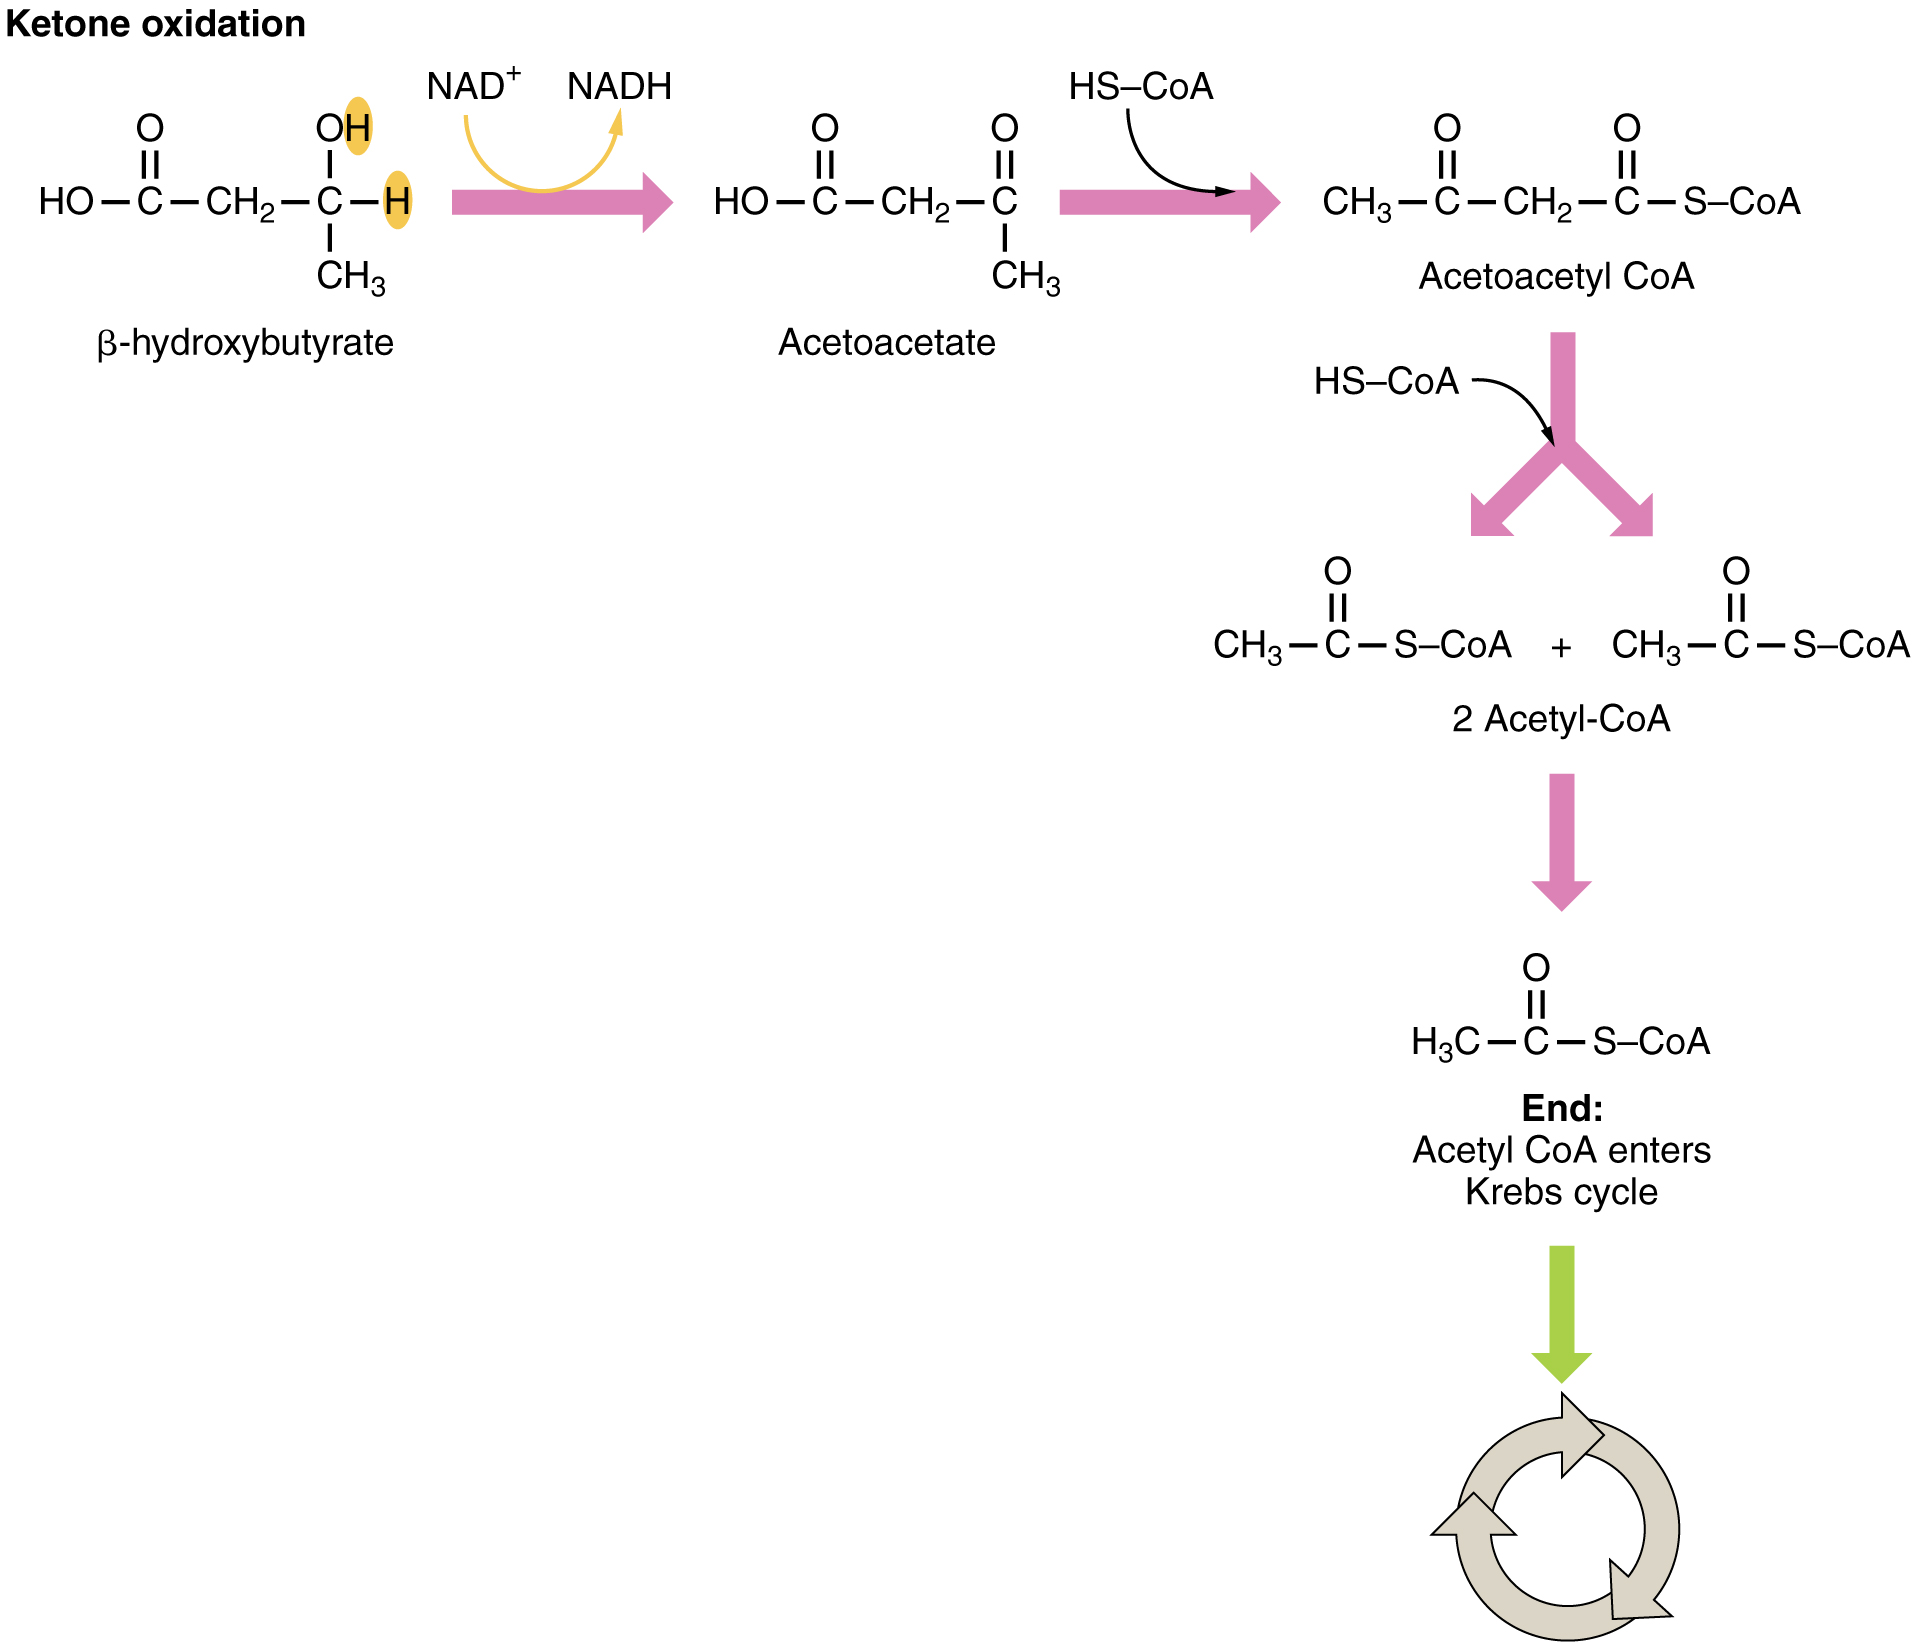
Ketones oxidize to produce energy for the brain. beta (β)-hydroxybutyrate is oxidized to acetoacetate and NADH is released. An HS-CoA molecule is added to acetoacetate, forming acetoacetyl CoA. The carbon within the acetoacetyl CoA that is not bonded to the CoA then detaches, splitting the molecule in two. This carbon then attaches to another free HS-CoA, resulting in two acetyl CoA molecules. These two acetyl CoA molecules are then processed through the Krebs cycle to generate energy (Figure 16.3.5).
Lipogenesis
When glucose levels are plentiful, the excess acetyl CoA generated by glycolysis can be converted into fatty acids, triglycerides, cholesterol, steroids, and bile salts. This process, called lipogenesis, creates lipids (fat) from the acetyl CoA and takes place in the cytoplasm of adipocytes (fat cells) and hepatocytes (liver cells). When you eat more glucose or carbohydrates than your body needs, your system uses acetyl CoA to turn the excess into fat. Although there are several metabolic sources of acetyl CoA, it is most commonly derived from glycolysis. Acetyl CoA availability is significant, because it initiates lipogenesis. Lipogenesis begins with acetyl CoA and advances by the subsequent addition of two carbon atoms from another acetyl CoA; this process is repeated until fatty acids are the appropriate length. Because this is a bond-creating anabolic process, ATP is consumed. However, the creation of triglycerides and lipids is an efficient way of storing the energy available in carbohydrates. Triglycerides and lipids, both high-energy molecules, are stored in adipose tissue until they are needed.
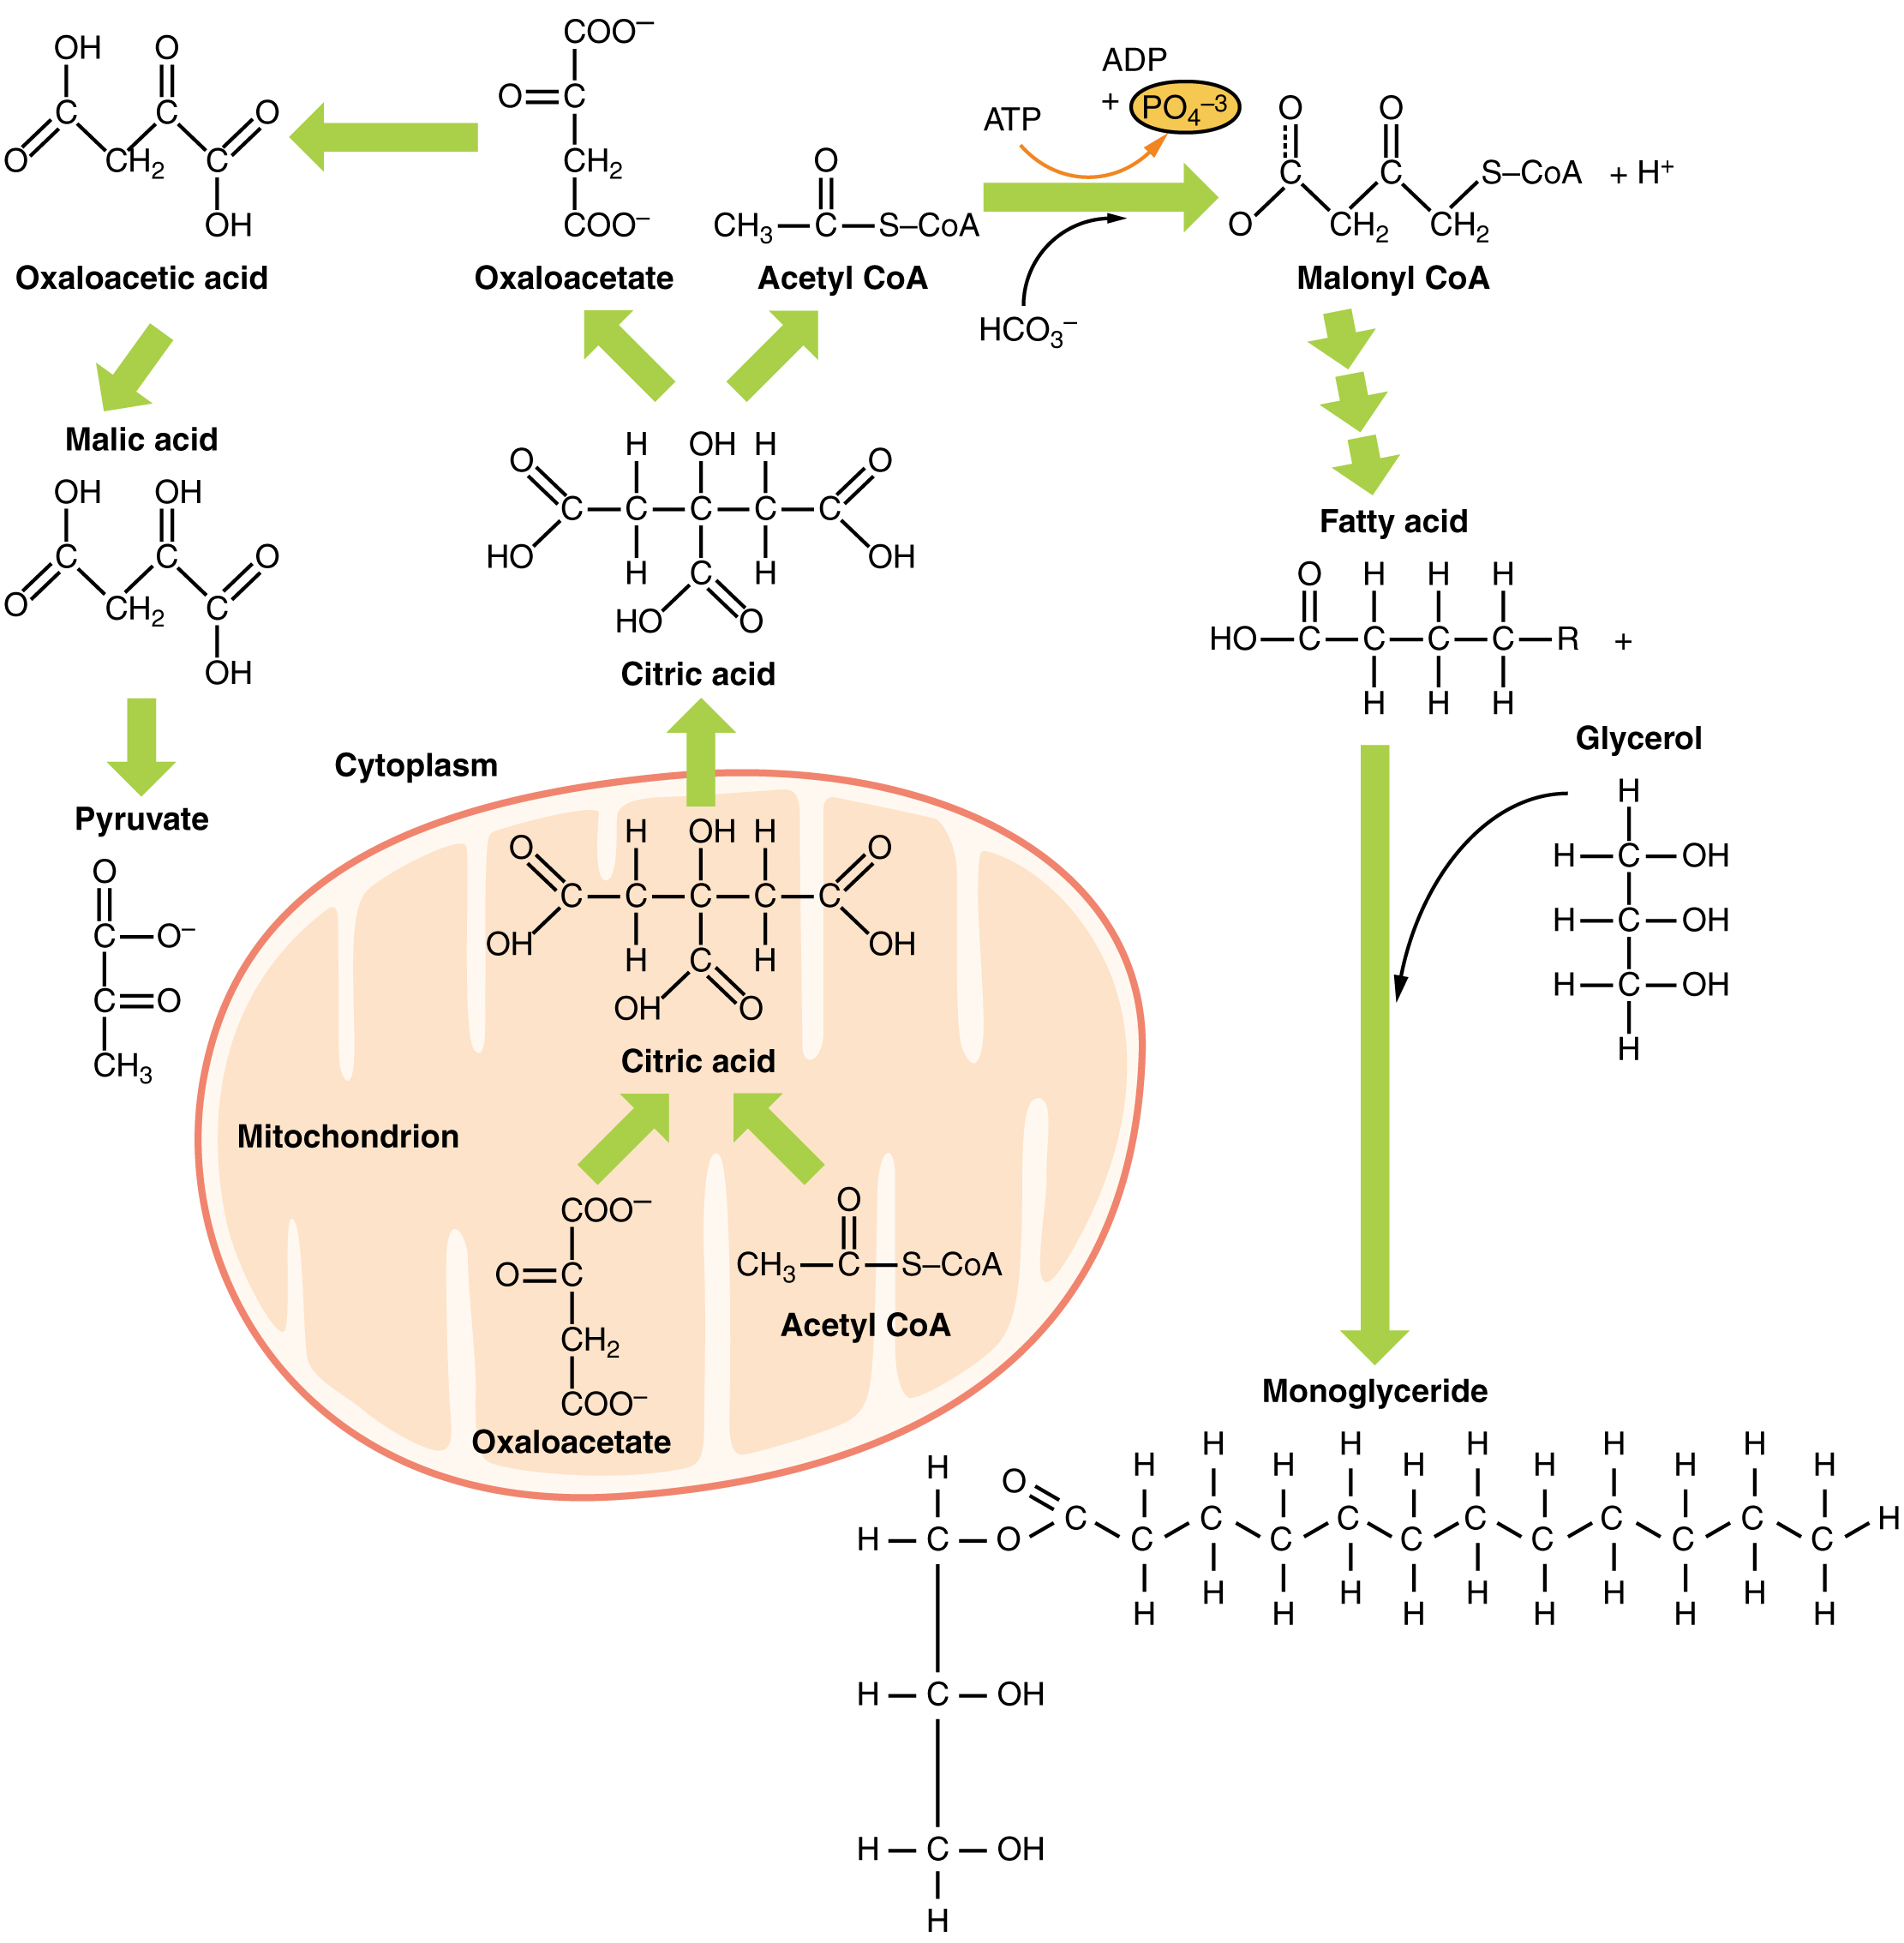
Although lipogenesis occurs in the cytoplasm, the necessary acetyl CoA is created in the mitochondria and cannot be transported across the mitochondrial membrane. To solve this problem, pyruvate is converted into both oxaloacetate and acetyl CoA. Two different enzymes are required for these conversions. Oxaloacetate forms via the action of pyruvate carboxylase, whereas the action of pyruvate dehydrogenase creates acetyl CoA. Oxaloacetate and acetyl CoA combine to form citrate, which can cross the mitochondrial membrane and enter the cytoplasm. In the cytoplasm, citrate is converted back into oxaloacetate and acetyl CoA. Oxaloacetate is converted into malate and then into pyruvate. Pyruvate crosses back across the mitochondrial membrane to wait for the next cycle of lipogenesis. The acetyl CoA is converted into malonyl CoA that is used to synthesize fatty acids. Figure 16.3.6 summarizes the pathways of lipid metabolism.
Section Review
Lipids are available to the body from three sources. They can be ingested in the diet, stored in the adipose tissue of the body, or synthesized in the liver. Fats ingested in the diet are digested in the small intestine. The triglycerides are broken down into monoglycerides and free fatty acids, then imported across the intestinal mucosa. Once across, the triglycerides are resynthesized and transported to the liver or adipose tissue. Fatty acids are oxidized through fatty acid or β-oxidation into two-carbon acetyl CoA molecules, which can then enter the Krebs cycle to generate ATP. If excess acetyl CoA is created and overloads the capacity of the Krebs cycle, the acetyl CoA can be used to synthesize ketone bodies. When glucose is limited, ketone bodies can be oxidized and used for fuel. Excess acetyl CoA generated from excess glucose or carbohydrate ingestion can be used for fatty acid synthesis or lipogenesis. Acetyl CoA is used to create lipids, triglycerides, steroid hormones, cholesterol, and bile salts. Lipolysis is the breakdown of triglycerides into glycerol and fatty acids, making them easier for the body to process.
Review Questions
Critical Thinking Questions
Glossary
- beta (β)-hydroxybutyrate
- primary ketone body produced in the body
- bile salts
- salts that are released from the liver in response to lipid ingestion and surround the insoluble triglycerides to aid in their conversion to monoglycerides and free fatty acids
- cholecystokinin (CCK)
- hormone that stimulates the release of pancreatic lipase and the contraction of the gallbladder to release bile salts
- chylomicrons
- vesicles containing cholesterol and triglycerides that transport lipids out of the intestinal cells and into the lymphatic and circulatory systems
- fatty acid oxidation
- breakdown of fatty acids into smaller chain fatty acids and acetyl CoA
- hydroxymethylglutaryl CoA (HMG CoA)
- molecule created in the first step of the creation of ketone bodies from acetyl CoA
- ketone bodies
- alternative source of energy when glucose is limited, created when too much acetyl CoA is created during fatty acid oxidation
- lipogenesis
- synthesis of lipids that occurs in the liver or adipose tissues
- lipolysis
- breakdown of triglycerides into glycerol and fatty acids
- monoglycerides
- lipids consisting of a single fatty acid chain attached to a glycerol backbone
- pancreatic lipases
- enzymes released from the pancreas that digest lipids in the diet
- triglycerides
- lipids, or fats, consisting of three fatty acid chains attached to a glycerol backbone
Glossary Flashcards
This work, Human Physiology, is adapted from Anatomy & Physiology by OpenStax, licensed under CC BY. This edition, with revised content and artwork, is licensed under CC BY-SA except where otherwise noted.
Images from Anatomy & Physiology by OpenStax are licensed under CC BY except where otherwise noted.
Access the original for free at OpenStax.
Image Descriptions
Figure 16.3.1. This figure compares the molecular structures of two types of lipid molecules. Part (a) shows a triglyceride molecule, which consists of a three-carbon glycerol backbone on the left side with three long fatty acid chains attached via ester bonds (C-O-C=O linkages). Each of the three positions on the glycerol backbone is esterified to a fatty acid chain composed of a long hydrocarbon tail with multiple carbon atoms, each bonded to hydrogen atoms. The fatty acid chains shown are saturated, meaning they contain only single bonds between carbon atoms, with each carbon bearing two hydrogen atoms along the chain length. Part (b) depicts a monoglyceride molecule, which has the same three-carbon glycerol backbone but with only one fatty acid chain attached to the top position via an ester bond. The middle and bottom positions of the glycerol backbone in the monoglyceride contain free hydroxyl groups (OH) instead of fatty acid chains, making this molecule more polar and amphipathic than the triglyceride. Both structures are drawn showing all atoms explicitly, with carbon (C), hydrogen (H), and oxygen (O) atoms labeled, and single bonds represented by lines connecting the atoms. The structures illustrate how triglycerides serve as efficient energy storage molecules with three fatty acids, while monoglycerides with only one fatty acid chain can function as emulsifiers due to their increased polarity. [Return to Figure 16.3.1]
Figure 16.3.2. This diagram illustrates the three-dimensional structure of a lipoprotein particle in cross-section. The spherical particle consists of three main components labeled in the image. The outer surface is formed by a phospholipid monolayer, shown as white circles arranged in a single layer that defines the particle’s boundary, with a dashed line indicating the circular perimeter. Embedded within this phospholipid layer are several large, blue, irregularly shaped embedded apolipoproteins that span the surface of the particle. The interior core of the lipoprotein is filled with triglycerides, depicted as densely packed tan or beige elongated structures representing the hydrophobic fatty acid chains. These triglycerides occupy the central region and are surrounded by the phospholipid layer. The apolipoproteins protrude from the surface and help stabilize the particle structure while also serving as recognition signals for cellular receptors. This arrangement allows lipoproteins to transport water-insoluble lipids through the aqueous bloodstream by sequestering hydrophobic triglycerides in the core while presenting a hydrophilic phospholipid surface to the surrounding environment. [Return to Figure 16.3.2]
Figure 16.3.3. This diagram illustrates the complete beta-oxidation pathway, which breaks down fatty acids into acetyl CoA molecules that can enter the Krebs cycle for energy production. The process begins at the top with a fatty acid molecule showing its chemical structure with a carboxyl group (OH group attached to C=O) and a hydrocarbon chain represented by R-CH₂-CH₂-CH₂. The first section, labeled “1) Converting a fatty acid to fatty acyl carnitine allows transport through the mitochondrial membranes,” shows the fatty acid combining with HS-CoA (coenzyme A) to form fatty acyl CoA. This then combines with carnitine, a molecule containing trimethylammonium and hydroxyl groups, to create fatty acyl carnitine, which can cross the mitochondrial membranes (illustrated by a small mitochondrion diagram). Once inside the mitochondrion, section 2 shows fatty acyl carnitine being converted back to fatty acyl CoA through the addition of HS-CoA. Section 3, titled “Fatty acyl CoA is converted to β-ketoacyl CoA, which is split into an Acyl CoA and Acetyl CoA,” depicts the core beta-oxidation cycle. The process begins with fatty acyl CoA, where two specific carbon atoms in the chain are highlighted in yellow circles. Through a series of reactions involving FAD⁺/FADH₂ (shown with pink arrows), the molecule is converted to trans-enoyl CoA, which contains a double bond. Water (H₂O) is then added, and another oxidation step using FAD⁺/FADH₂ produces β-ketoacyl CoA, with the beta-carbon (second carbon from the CoA group) now bearing a ketone group (C=O), marked with a yellow circle labeled “β-carbon oxidation.” This β-ketoacyl CoA is then cleaved by HS-CoA to produce two molecules: acetyl CoA (a two-carbon unit, S-CoA-C-CH₃) and a new acyl CoA molecule with a shortened carbon chain (now two carbons shorter than the original). At the bottom, the acetyl CoA product is shown entering the Krebs cycle, depicted as a circular arrow diagram, where it will be further oxidized to produce energy. Pink arrows throughout indicate the forward progression of reactions, while the chemical structures show all relevant functional groups including carbonyl groups (C=O), thioester bonds (CoA-S-C), and hydrocarbon chains. [Return to Figure 16.3.3]
Figure 16.3.4. This biochemical pathway diagram illustrates the synthesis of ketone bodies from acetyl CoA, a process known as ketogenesis. At the top left, two acetyl CoA molecules are shown with their chemical structures, each consisting of a two-carbon acetyl group (CH₃-C=O) attached to coenzyme A via a thioester bond (S-CoA), with the thioester linkage circled in one structure. Green arrows indicate that these two acetyl CoA molecules condense to form acetoacetyl CoA, a four-carbon molecule (CH₃-C=O-CH₂-C=O-S-CoA) shown below. The pathway continues with another acetyl CoA adding to acetoacetyl CoA to form the six-carbon intermediate β-hydroxy-β-methylglutaryl CoA (HMG CoA), depicted in the center within an oval. The HMG CoA structure shows a branched molecule with a hydroxyl group (OH) and methyl group (CH₃) attached to the beta carbon. This intermediate then releases CO₂ (carbon dioxide) and loses the CoA group to form acetoacetate (CH₃-C=O-CH₂-C=O), a four-carbon ketone body. Finally, on the right side, acetoacetate can be reduced to β-hydroxybutyrate, shown with its chemical structure where one of the ketone groups has been converted to a hydroxyl group, with hydrogen atoms (marked as circled H) added during the reduction. Black curved arrows above certain carbons indicate the electron movements or bonds being formed/broken during the reactions. This metabolic pathway is particularly important during fasting or low-carbohydrate conditions when the body needs alternative fuel sources for the brain and other tissues. [Return to Figure 16.3.4]
Figure 16.3.5. This biochemical diagram illustrates the process of ketone oxidation, showing how ketone bodies are converted back into metabolically useful acetyl CoA molecules. The pathway begins at the top left with β-hydroxybutyrate, a four-carbon molecule with the chemical structure HO-C=O-CH₂-C-H-CH₃, where a hydroxyl group (OH) and hydrogen (H) are highlighted in yellow boxes. In the first reaction, β-hydroxybutyrate undergoes oxidation as NAD⁺ is reduced to NADH (shown with an orange curved arrow), converting the hydroxyl group to a ketone and removing the hydrogen to form acetoacetate (HO-C=O-CH₂-C=O-CH₃). Pink arrows indicate the progression through each step. Next, acetoacetate reacts with coenzyme A (HS-CoA) to produce acetoacetyl CoA (CH₃-C=O-CH₂-C=O-S-CoA), a four-carbon thioester. The diagram then shows acetoacetyl CoA being cleaved by another molecule of HS-CoA, splitting at a branching point indicated by pink arrows, to yield two separate acetyl CoA molecules (each with the structure CH₃-C=O-S-CoA). These two identical acetyl CoA products are shown side by side with a plus sign between them. Finally, at the bottom of the diagram, the text indicates that acetyl CoA enters the Krebs cycle, illustrated by a green arrow pointing to a circular diagram representing the cyclic nature of the Krebs cycle. This pathway effectively reverses ketone body formation and allows tissues like the heart and brain to use ketone bodies as an alternative fuel source when glucose is limited. [Return to Figure 16.3.5]
Figure 16.3.6. This comprehensive biochemical diagram illustrates the metabolic relationships between carbohydrate metabolism and lipid synthesis, showing how cells can convert intermediates from one pathway into another. The diagram is organized with reactions occurring both outside and inside the mitochondrion, depicted as a large oval structure with an orange membrane in the center. At the top left, the diagram shows oxaloacetic acid, a four-carbon molecule with two carboxyl groups (COO⁻) and hydroxyl groups (OH), which can be converted to malic acid and then to pyruvate (CH₃-C=O-COO⁻). Green arrows indicate these conversions occur in the cytoplasm. The central region shows the Krebs cycle occurring within the mitochondrion, where citric acid (with its detailed chemical structure showing a six-carbon backbone with three carboxyl groups and one hydroxyl group) is formed from the combination of acetyl CoA (CH₃-C=O-S-CoA) and oxaloacetate. Citric acid can exit the mitochondrion and enter the cytoplasm, where it can be cleaved back into oxaloacetate and acetyl CoA. In the upper right portion, the diagram shows how acetyl CoA can enter lipid synthesis. Acetyl CoA combines with bicarbonate (HCO₃⁻) using ATP energy (shown converting to ADP with release of inorganic phosphate, PO₄³⁻, highlighted in yellow) to form malonyl CoA, a three-carbon unit attached to coenzyme A. Multiple green arrows flowing downward indicate that malonyl CoA serves as the building block for fatty acid synthesis, producing a fatty acid chain shown with its chemical structure (HO-C=O-C-C-C-R with all hydrogen atoms displayed). The fatty acid is then shown combining with glycerol (a three-carbon molecule with three hydroxyl groups: H-C-OH-H-C-OH-H-C-OH) to form a monoglyceride, depicted at the bottom with a detailed structure showing the glycerol backbone esterified to one long fatty acid chain containing multiple CH₂ groups. This diagram effectively demonstrates how excess carbohydrates from the Krebs cycle can be diverted into fat storage through the conversion of citric acid intermediates into acetyl CoA, which then serves as the precursor for fatty acid and ultimately triglyceride synthesis, explaining the biochemical basis for how dietary carbohydrates can be stored as body fat. [Return to Figure 16.3.6]
Report an Error
Did you find an error, typo, broken link, or other problem in the text? Please follow this link to the error reporting form to submit an error report to the authors.