Chapter 16. Metabolism and Nutrition
16.4 Protein Metabolism
Learning Objectives
By the end of this section, you will be able to:
- Describe how, when, and why the body metabolizes proteins
- Describe how the body digests proteins
- Explain how the urea cycle prevents toxic concentrations of nitrogen
- Differentiate between glucogenic and ketogenic amino acids
- Explain how protein can be used for energy
Much of the body is made of protein, and these proteins take on a myriad of forms. They represent cell signaling receptors, signaling molecules, structural members, enzymes, intracellular trafficking components, extracellular matrix scaffolds, ion pumps, ion channels, oxygen and CO2 transporters (hemoglobin). That is not even the complete list! There is protein in bones (collagen), muscles, and tendons; the hemoglobin that transports oxygen; and enzymes that catalyze all biochemical reactions. Protein is also used for growth and repair. Amid all these necessary functions, proteins also hold the potential to serve as a metabolic fuel source. Proteins are not stored for later use, so excess proteins must be converted into glucose or triglycerides and used to supply energy or build energy reserves. Although the body can synthesize proteins from amino acids, food is an important source of those amino acids, especially because humans cannot synthesize all of the 20 amino acids used to build proteins.
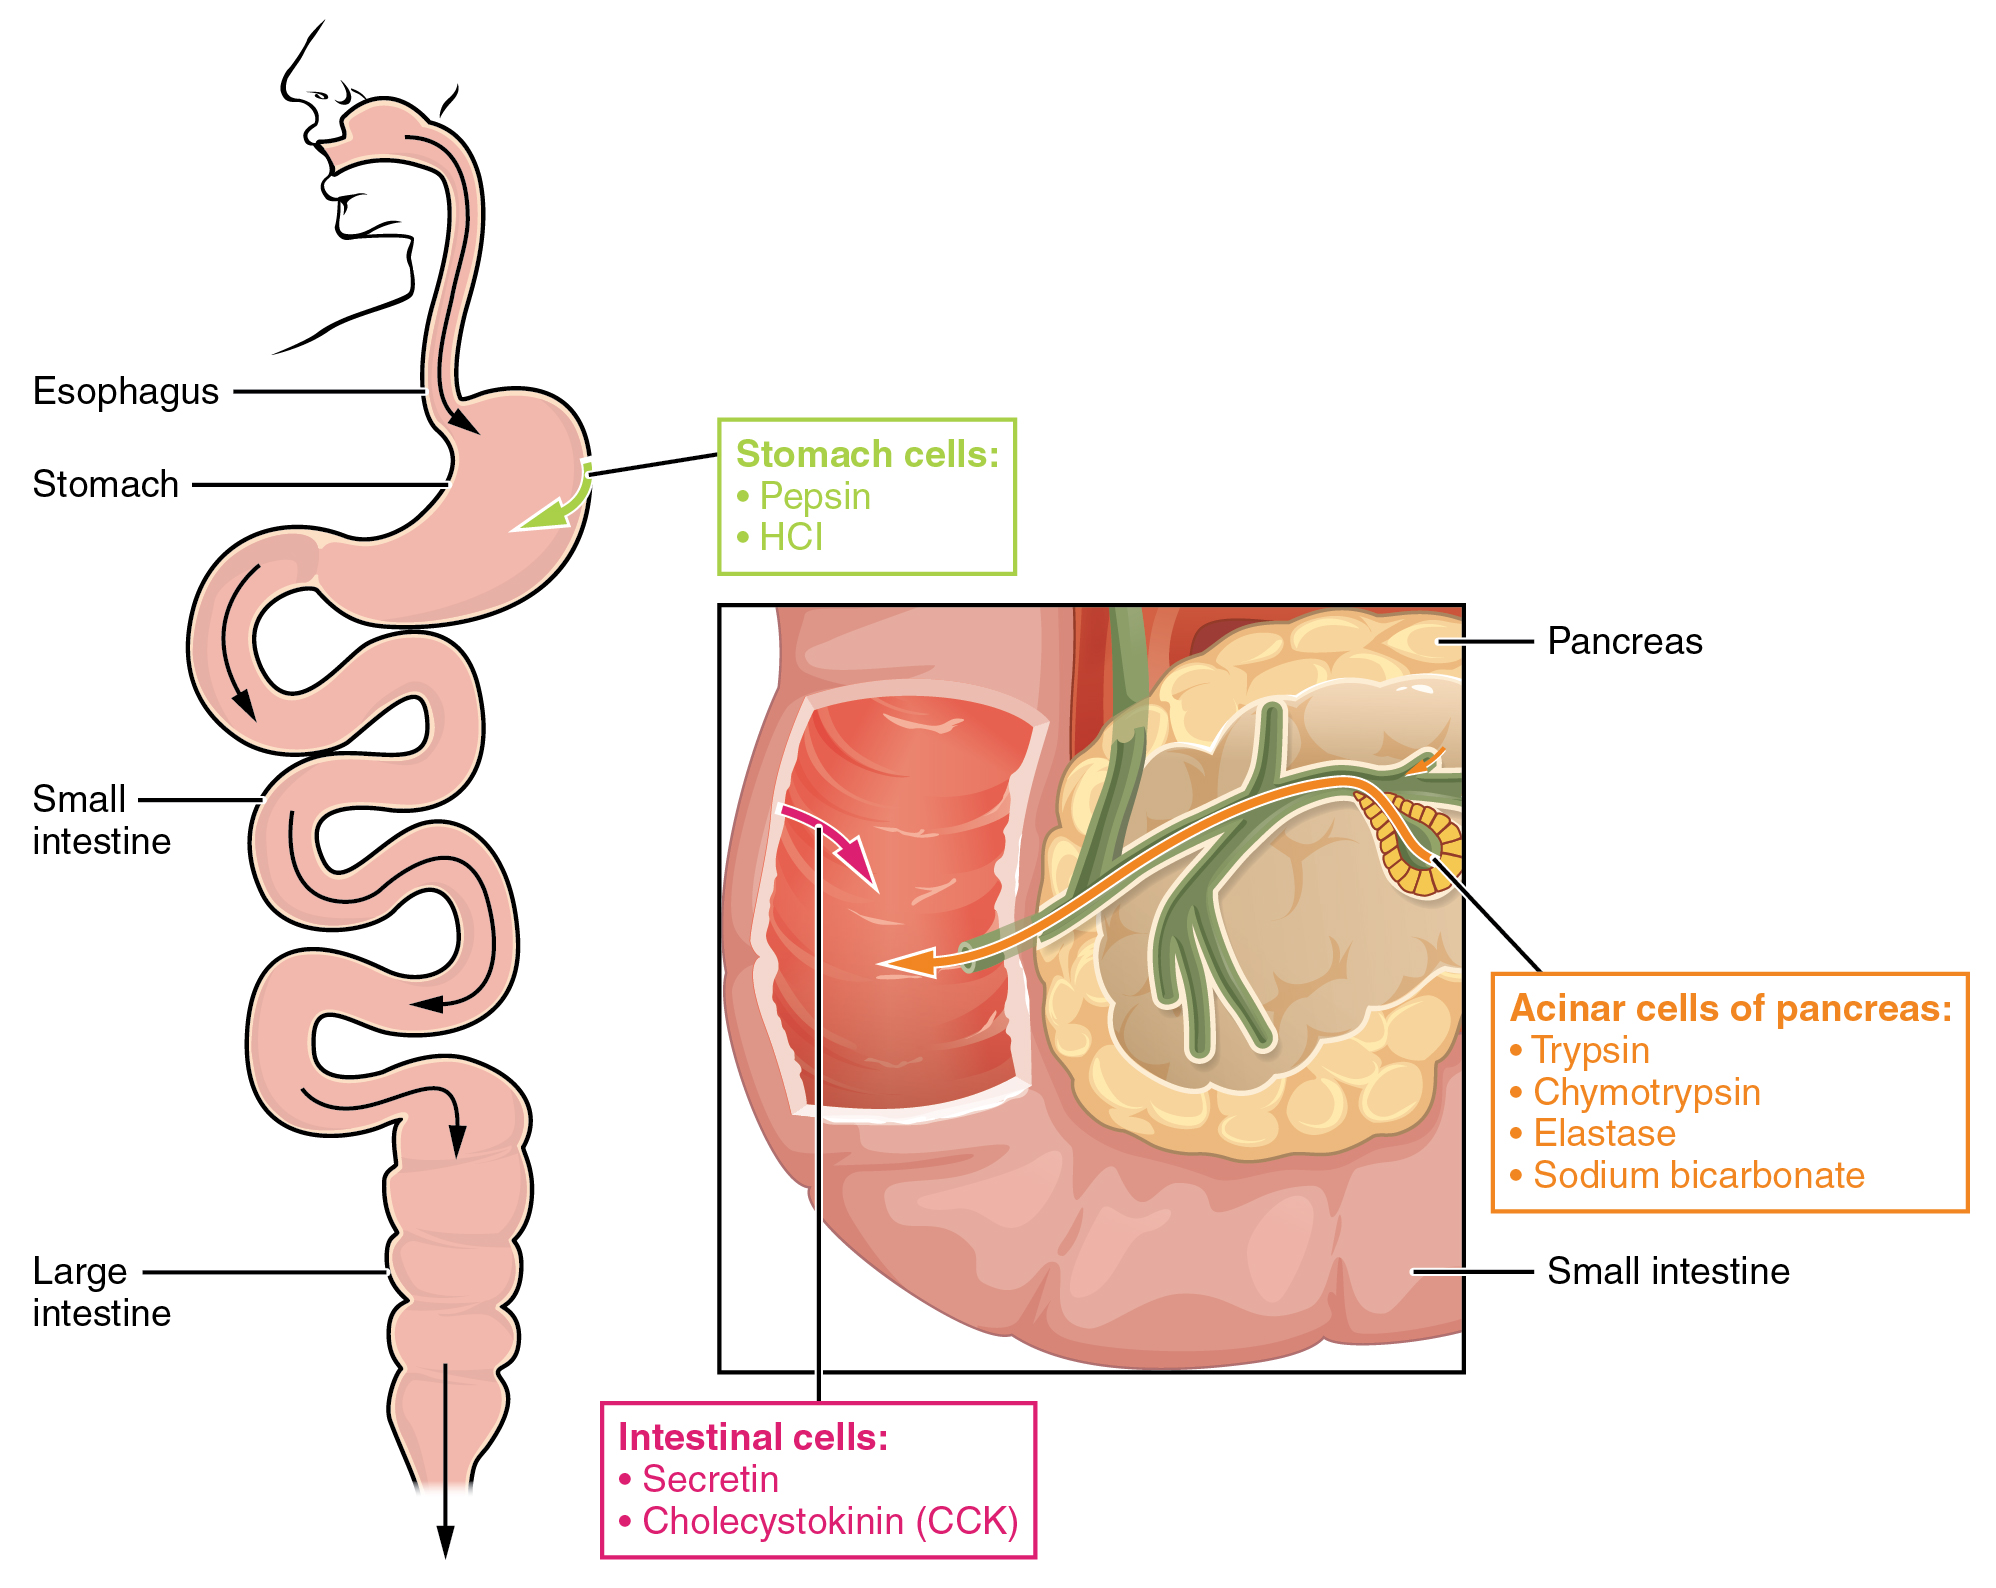
The digestion of proteins begins in the stomach. When protein-rich foods enter the stomach, they are greeted by a mixture of the enzyme pepsin and hydrochloric acid (HCl; 0.5%). The latter produces an environmental pH of 1.5–3.5 that denatures proteins within food. Pepsin cuts proteins into smaller polypeptides and their constituent amino acids. When the food-gastric juice mixture (chyme) enters the small intestine, the pancreas releases sodium bicarbonate to neutralize the HCl. This helps to protect the lining of the intestine. The small intestine also releases digestive hormones, including secretin and CCK, which stimulate digestive processes to break down the proteins further. Secretin also stimulates the pancreas to release sodium bicarbonate. The pancreas releases most of the digestive enzymes, including the proteases trypsin, chymotrypsin, carboxypeptidase, and elastase, which aid protein digestion. Together, all of these enzymes break complex proteins into smaller individual amino acids (Figure 16.4.1), which are then transported across the intestinal mucosa to be used to create new proteins, or to be converted into fats or acetyl CoA and used in the Krebs cycle.
In order to avoid breaking down the proteins that make up the pancreas and small intestine, pancreatic enzymes are released as inactive proenzymes that are only activated in the small intestine. In the pancreas, vesicles store trypsin, chymotrypsin, and carboxypeptidase as trypsinogen, chymotrypsinogen, and procarboxypeptidase. Once released into the small intestine, an enzyme found in the wall of the small intestine, called enterokinase, binds to trypsinogen and converts it into its active form, trypsin. Trypsin then binds to chymotrypsinogen and procarboxypeptidase to convert it into the active chymotrypsin and carboxypeptidase. Trypsin, chymotrypsin, and carboxypeptidase break down large proteins into smaller peptides, a process called proteolysis. These smaller peptides are catabolized into their constituent amino acids by the brush border enzymes, aminopeptidase and dipeptidase. The free amino acids are then transported across the apical surface of the intestinal mucosa in a process that is mediated by secondary active transport using sodium-amino acid transporters. These transporters bind sodium and then bind the amino acid to transport it across the membrane. At the basal surface of the mucosal cells, the sodium and amino acid are released. The sodium can be reused in the transporter, whereas the amino acids are transferred into the bloodstream to be transported to the liver and cells throughout the body for protein synthesis.
Freely available amino acids are used to create proteins. If amino acids exist in excess, the body has no capacity or mechanism for their storage; thus, they are converted into glucose or ketones, or they are decomposed. Amino acid decomposition results in hydrocarbons and nitrogenous waste. However, high concentrations of nitrogen are toxic as they produce ammonium ions. The urea cycle processes nitrogen and facilitates its excretion from the body.
Urea Cycle
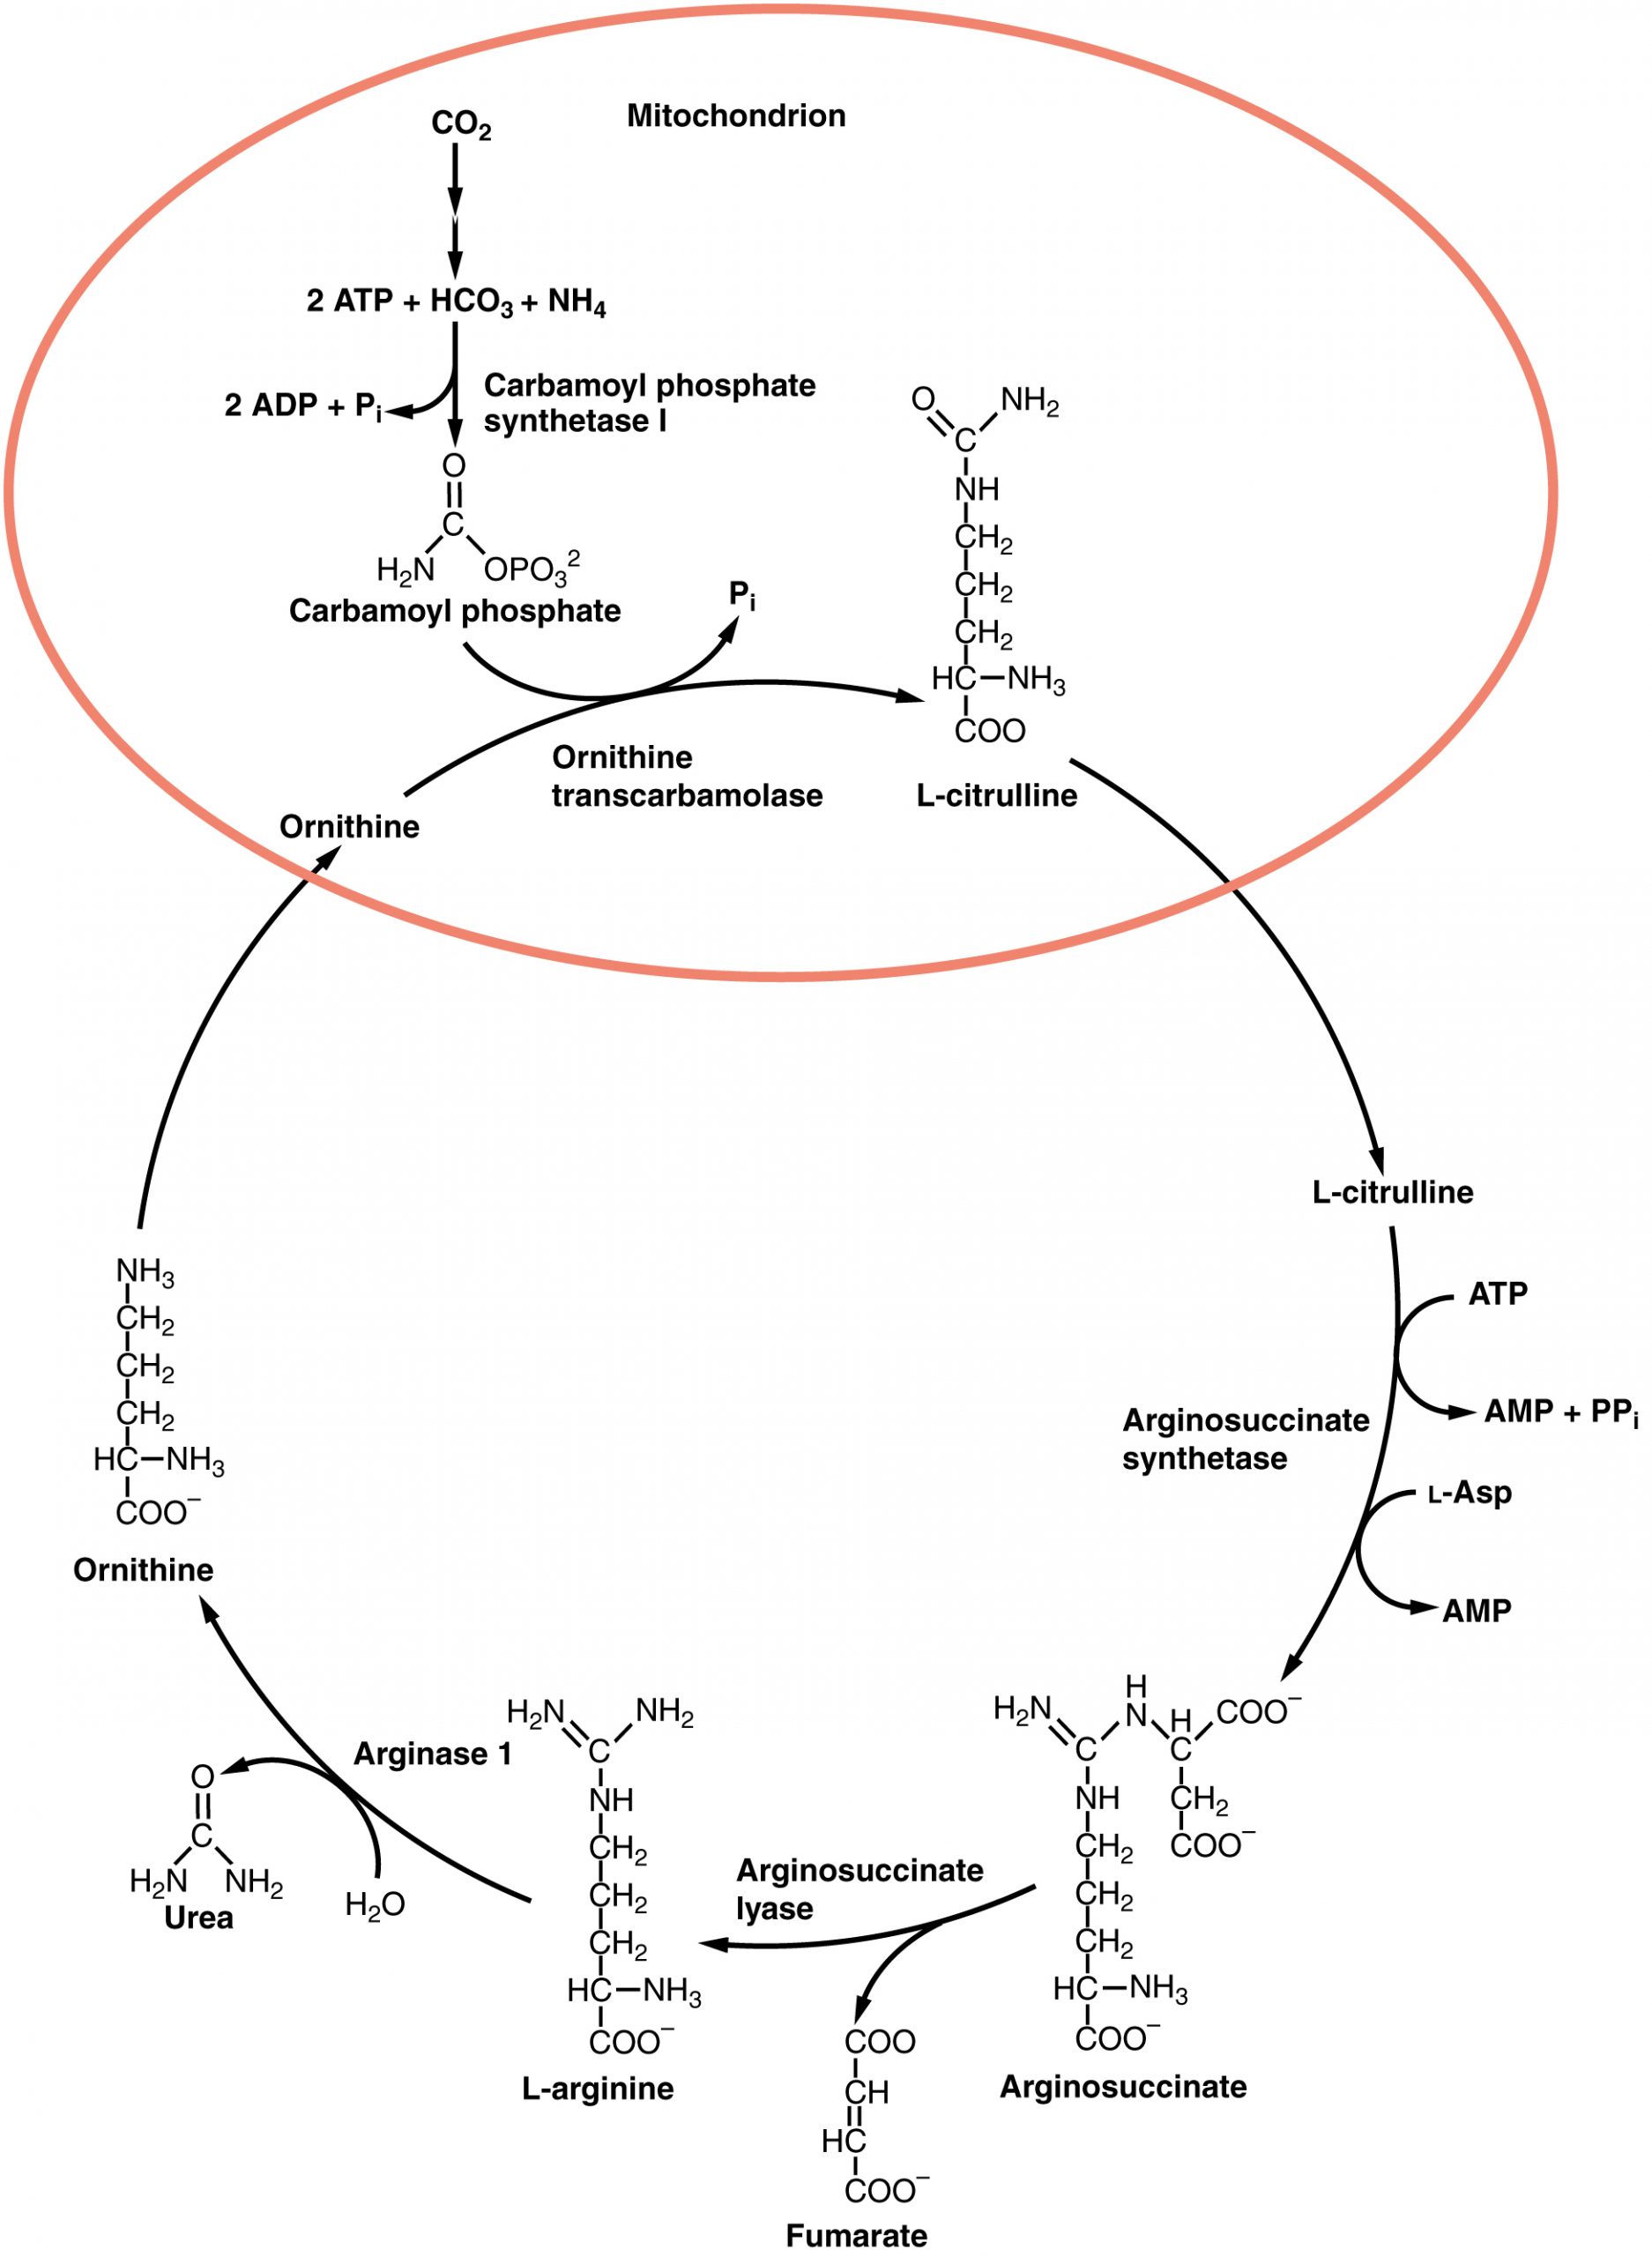
The urea cycle is a set of biochemical reactions that produces urea from ammonium ions in order to prevent a toxic level of ammonium in the body, as urea is much less toxic to cells than ammonium. It occurs primarily in the liver and, to a lesser extent, in the kidney. Prior to the urea cycle, ammonium ions are produced from the breakdown of amino acids. In these reactions, an amine group, or ammonium ion, from the amino acid is exchanged with a keto group on another molecule. This transamination event creates a molecule that is necessary for the Krebs cycle and an ammonium ion (NH4+) that enters into the urea cycle to be eliminated.
In the urea cycle, ammonium is combined with CO2, resulting in urea and water. The urea is eliminated through the kidneys in the urine (Figure 16.4.2).
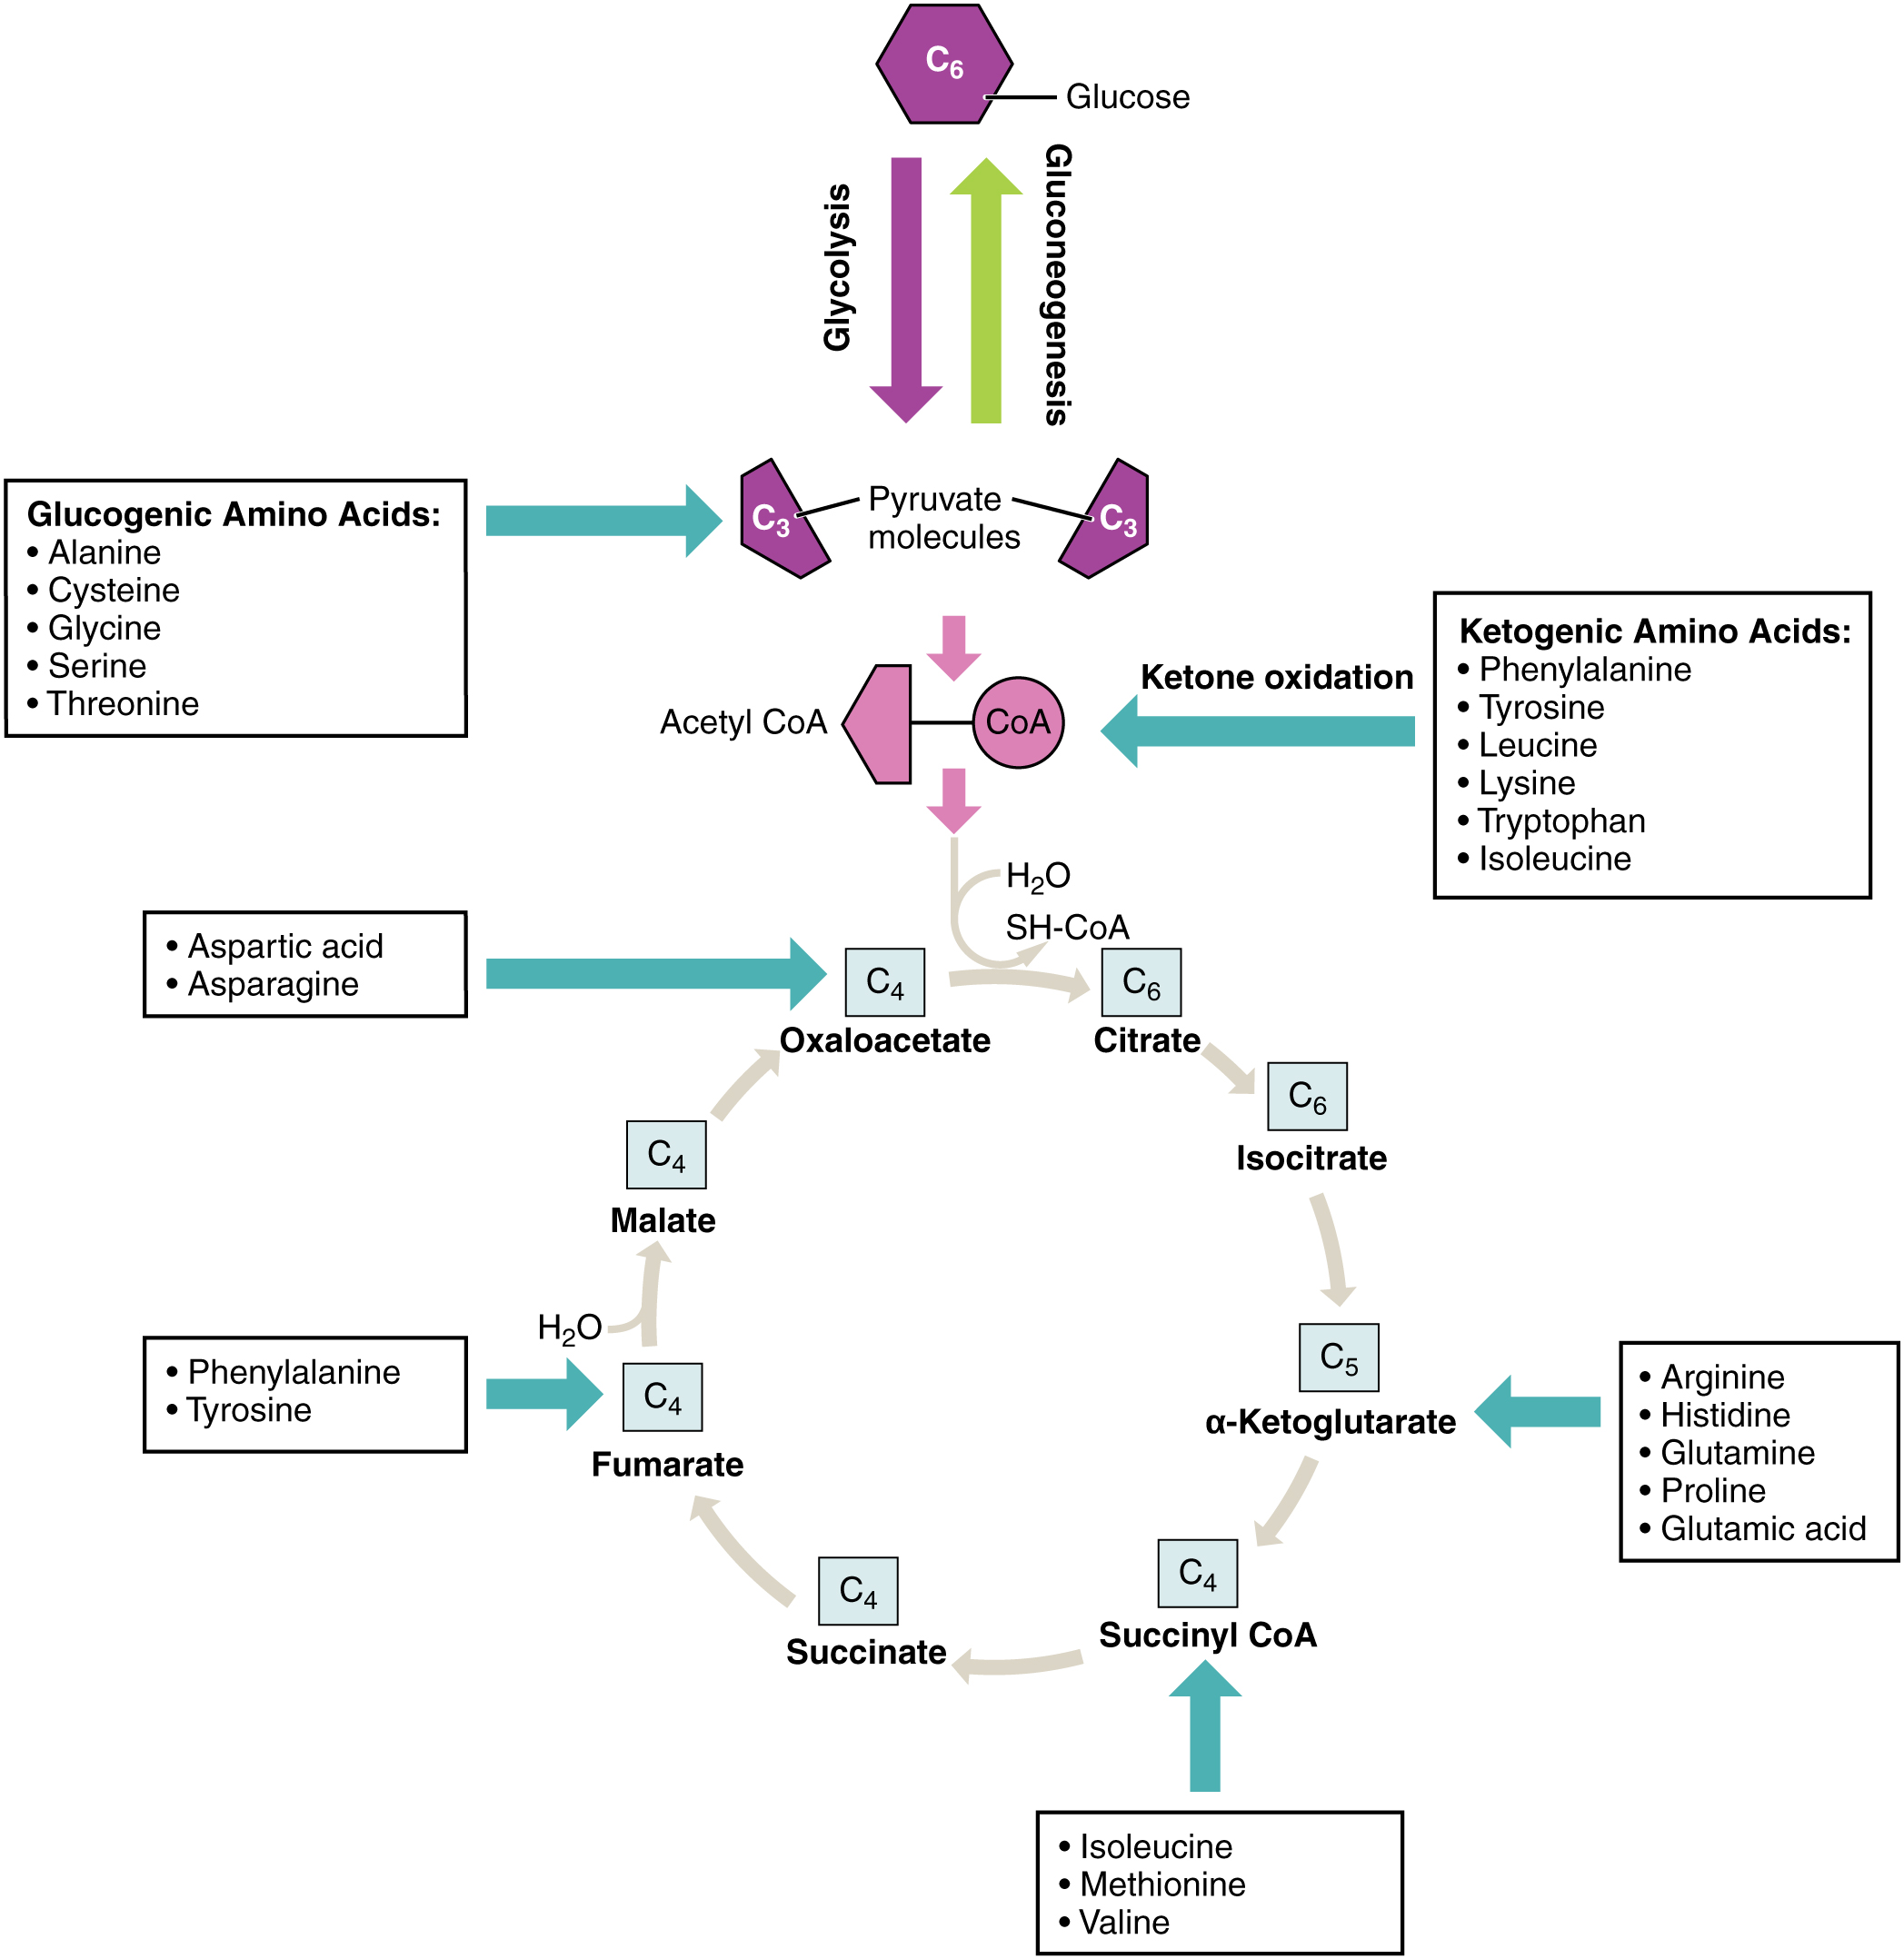
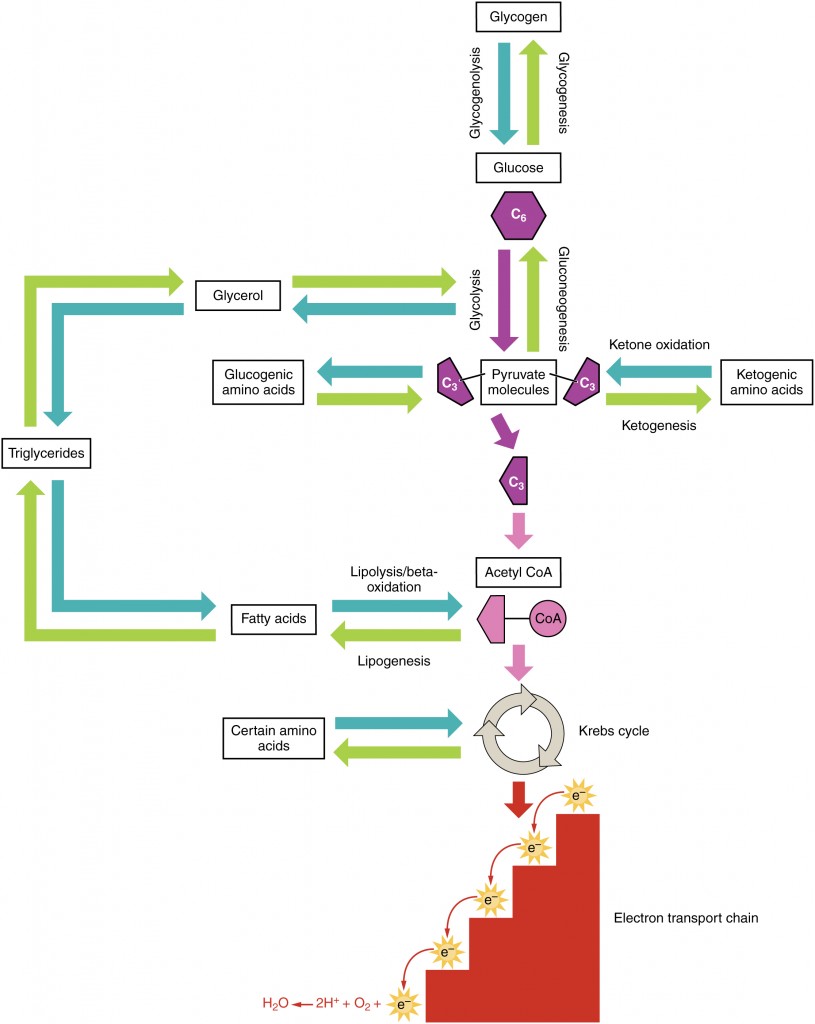
Amino acids can also be used as a source of energy, especially in times of starvation. Because the processing of amino acids results in the creation of metabolic intermediates, including pyruvate, acetyl CoA, acetoacyl CoA, oxaloacetate, and α-ketoglutarate, amino acids can serve as a source of energy production through the Krebs cycle (Figure 16.4.3). Figure 16.4.4 summarizes the pathways of catabolism and anabolism for carbohydrates, lipids, and proteins.
Disorders of Metabolism – Pyruvate Dehydrogenase Complex Deficiency and Phenylketonuria
Pyruvate dehydrogenase complex deficiency (PDCD) and phenylketonuria (PKU) are genetic disorders. Pyruvate dehydrogenase is the enzyme that converts pyruvate into acetyl CoA, the molecule necessary to begin the Krebs cycle to produce ATP. With low levels of the pyruvate dehydrogenase complex (PDC), the rate of cycling through the Krebs cycle is dramatically reduced. This results in a decrease in the total amount of energy that is produced by the cells of the body. PDC deficiency results in a neurodegenerative disease that ranges in severity, depending on the levels of the PDC enzyme. It may cause developmental defects, muscle spasms, and death. Treatments can include diet modification, vitamin supplementation, and gene therapy; however, damage to the central nervous system usually cannot be reversed.
PKU affects about 1 in every 15,000 births in the United States. People afflicted with PKU lack sufficient activity of the enzyme phenylalanine hydroxylase and are therefore unable to break down phenylalanine into tyrosine adequately. Because of this, levels of phenylalanine rise to toxic levels in the body, which results in damage to the central nervous system and brain. Symptoms include delayed neurological development, hyperactivity, mental retardation, seizures, skin rash, tremors, and uncontrolled movements of the arms and legs. Pregnant women with PKU are at a high risk for exposing the fetus to too much phenylalanine, which can cross the placenta and affect fetal development. Babies exposed to excess phenylalanine in utero may present with heart defects, physical and/or mental retardation, and microcephaly. Every infant in the United States and Canada is tested at birth to determine whether PKU is present. The earlier a modified diet is begun, the less severe the symptoms will be. The person must closely follow a strict diet that is low in phenylalanine to avoid symptoms and damage. Phenylalanine is found in high concentrations in artificial sweeteners, including aspartame. Therefore, these sweeteners must be avoided. Some animal products and certain starches are also high in phenylalanine, and intake of these foods should be carefully monitored.
Section Review
Digestion of proteins begins in the stomach, where HCl and pepsin begin the process of breaking down proteins into their constituent amino acids. As the chyme enters the small intestine, it mixes with bicarbonate and digestive enzymes. The bicarbonate neutralizes the acidic HCl, and the digestive enzymes break down the proteins into smaller peptides and amino acids. Digestive hormones secretin and CCK are released from the small intestine to aid in digestive processes, and digestive proenzymes are released from the pancreas (trypsinogen and chymotrypsinogen). Enterokinase, an enzyme located in the wall of the small intestine, activates trypsin, which in turn activates chymotrypsin. These enzymes liberate the individual amino acids that are then transported via sodium-amino acid transporters across the intestinal wall into the cell. The amino acids are then transported into the bloodstream for dispersal to the liver and cells throughout the body to be used to create new proteins. When in excess, the amino acids are processed and stored as glucose or ketones. The nitrogen waste that is liberated in this process is converted to urea in the urea acid cycle and eliminated in the urine. In times of starvation, amino acids can be used as an energy source and processed through the Krebs cycle.
Review Questions
Critical Thinking Questions
Glossary
- enterokinase
- enzyme located in the wall of the small intestine that activates trypsin
- pepsin
- enzyme that begins to break down proteins in the stomach
- proenzymes
- forms in which proteases are stored and released to prevent the inappropriate digestion of the native proteins of the stomach, pancreas, and small intestine
- proteolysis
- process of breaking proteins into smaller peptides
- secretin
- hormone released in the small intestine to aid in digestion
- transamination
- transfer of an amine group from one molecule to another as a way to turn nitrogen waste into ammonia so that it can enter the urea cycle
- trypsin
- pancreatic enzyme that activates chymotrypsin and digests protein
- trypsinogen
- proenzyme form of trypsin
- urea cycle
- process that converts potentially toxic nitrogen waste into urea that can be eliminated through the kidneys
Glossary Flashcards
This work, Human Physiology, is adapted from Anatomy & Physiology by OpenStax, licensed under CC BY. This edition, with revised content and artwork, is licensed under CC BY-SA except where otherwise noted.
Images from Anatomy & Physiology by OpenStax are licensed under CC BY except where otherwise noted.
Access the original for free at OpenStax.
Image Descriptions
Figure 16.4.1. This anatomical diagram illustrates the digestive system and the key enzymes and hormones involved in protein digestion. On the left side, a simplified outline of the human digestive tract is shown in profile, beginning with the esophagus at the top, followed by the stomach, small intestine, and large intestine, with black arrows indicating the direction of food flow downward through the system. A green text box points to the stomach, indicating that stomach cells produce pepsin and hydrochloric acid (HCl), the initial components of protein digestion. The right portion features an enlarged cross-sectional view in a black-bordered box, showing the anatomical relationship between the stomach (depicted in pink/red), the pancreas (shown in beige/yellow at the top), and the small intestine (in pink at the bottom). Green and orange tube-like structures represent ducts connecting these organs. Two arrows indicate the flow of digestive secretions: a pink arrow shows stomach acid moving into the small intestine, and an orange arrow shows pancreatic enzymes flowing from the pancreas into the small intestine through the pancreatic duct. An orange text box lists the acinar cells of the pancreas and their protein-digesting enzymes, including trypsin, chymotrypsin, and elastase, as well as sodium bicarbonate which neutralizes stomach acid. At the bottom, a pink text box indicates that intestinal cells produce the hormones secretin and cholecystokinin (CCK), which regulate digestive processes. This comprehensive diagram demonstrates how protein digestion begins in the stomach with pepsin and acid, continues in the small intestine with pancreatic proteases, and is coordinated by hormonal signals from the intestinal lining. [Return to Figure 16.4.1]
Figure 16.4.2. This biochemical diagram illustrates the urea cycle, the metabolic pathway that converts toxic ammonia into urea for excretion. The cycle is divided between two cellular compartments: reactions occurring within the mitochondrion (shown in the upper portion enclosed by a pink/coral oval) and reactions taking place in the cytoplasm (shown in the lower portion). The cycle begins in the mitochondrion where carbon dioxide (CO₂) combines with bicarbonate (HCO₃⁻) and ammonia (NH₃) using 2 ATP molecules, catalyzed by carbamoyl phosphate synthetase I, to form carbamoyl phosphate (H₂N-C=O-OPO₃²⁻), releasing 2 ADP and inorganic phosphate (Pᵢ). Carbamoyl phosphate then reacts with ornithine through the enzyme ornithine transcarbamolase, releasing another Pᵢ, to produce L-citrulline. The chemical structure of L-citrulline is shown with its amino acid backbone (H₂N-C=O-NH-CH₂-CH₂-CH₂-HC-NH₃-COO⁻). L-citrulline exits the mitochondrion and enters the cytoplasm, where it combines with L-aspartate (L-Asp) via argininosuccinate synthetase, consuming ATP and producing AMP and pyrophosphate (PPᵢ), to form argininosuccinate. The detailed structure of argininosuccinate shows two amino acid residues joined together. Argininosuccinate lyase then cleaves argininosuccinate into fumarate (shown with its structure: COO⁻-CH=CH-COO⁻) and L-arginine. L-arginine’s complete structure is displayed showing its guanidinium group (H₂N-C=NH₂-NH-) attached to the amino acid backbone. Finally, arginase 1 hydrolyzes L-arginine with water (H₂O) to produce urea (H₂N-C=O-NH₂) and regenerate ornithine, which can then be transported back into the mitochondrion to restart the cycle. Black arrows throughout the diagram indicate the direction of reactions and the cyclic nature of this essential nitrogen disposal pathway. [Return to Figure 16.4.2]
Figure 16.4.3. This metabolic pathway diagram illustrates how amino acids can be broken down into precursors that feed into either glycolysis or the Krebs cycle (citric acid cycle). At the top, a purple hexagon labeled C₆ represents glucose, with bidirectional arrows showing glycolysis (purple arrow pointing down) and gluconeogenesis (green arrow pointing up) that interconvert glucose and two pyruvate molecules (C₃). Multiple amino acids can enter these central metabolic pathways at different points, shown by teal arrows from white boxes containing amino acid names. On the left side, a box lists glucogenic amino acids including alanine, cysteine, glycine, serine, and threonine, which feed into pyruvate. On the right side, a box lists ketogenic amino acids including phenylalanine, tyrosine, leucine, lysine, tryptophan, and isoleucine, which can be converted through ketone oxidation to acetyl CoA. The center shows pyruvate converting to acetyl CoA (depicted with a pink CoA circle), which then enters the Krebs cycle. The Krebs cycle is represented by beige arrows connecting various intermediates in a circular pathway: citrate (C₆), isocitrate (C₆), α-ketoglutarate (C₅), succinyl CoA (C₄), succinate (C₄), fumarate (C₄), malate (C₄), and oxaloacetate (C₄). The subscript numbers indicate the carbon count in each molecule. Different amino acids enter the cycle at specific points indicated by teal arrows. Aspartic acid and asparagine enter at oxaloacetate (C₄). Arginine, histidine, glutamine, proline, and glutamic acid enter at α-ketoglutarate (C₅). Isoleucine, methionine, and valine enter at succinyl CoA (C₄). Phenylalanine and tyrosine (shown in bold in the original, indicating they can enter through multiple pathways) enter at fumarate (C₄), with water (H₂O) involvement noted. This diagram demonstrates the metabolic versatility of amino acids, showing how their carbon skeletons can be channeled into central energy-producing pathways or used for glucose synthesis, with some amino acids having multiple entry points into these interconnected metabolic networks. [Return to Figure 16.4.3]
Figure 16.4.4. This comprehensive metabolic diagram illustrates the interconnected pathways of cellular metabolism, showing how carbohydrates, lipids, and proteins can be interconverted and used for energy production. The diagram flows from top to bottom, beginning with glycogen at the top. Bidirectional arrows show glycogen can be broken down through glycogenolysis (teal arrow pointing down) or synthesized through glycogenesis (green arrow pointing up) to and from glucose, represented by a purple hexagon labeled C₆. Glucose can similarly undergo glycolysis (purple arrow down) or be synthesized through gluconeogenesis (green arrow up) to form two pyruvate molecules (C₃). At the pyruvate level, multiple pathways converge and diverge. On the left side, glycerol (shown in a white box) connects bidirectionally to glucose through glycolysis and gluconeogenesis pathways. Glycerol also connects bidirectionally to triglycerides, with arrows showing breakdown (teal) and synthesis (green). Triglycerides further connect to fatty acids through lipolysis/beta-oxidation (teal arrow) and lipogenesis (green arrow). The center shows pyruvate as a metabolic hub connecting to several pathways. Glucogenic amino acids (in a white box on the left) can be converted to pyruvate via teal and green arrows. Pyruvate proceeds downward through a purple arrow to acetyl CoA (C₂), shown with a pink CoA circle attached. Ketogenic amino acids (shown in a box on the right) connect to acetyl CoA through ketone oxidation (teal arrow), and acetyl CoA can also form ketone bodies through ketogenesis (green arrow pointing right). Fatty acids from the left also feed into acetyl CoA through lipolysis/beta-oxidation. From acetyl CoA, a pink arrow leads down to the Krebs cycle, represented by a circular diagram with beige arrows indicating the cyclic nature of the pathway. Certain amino acids (shown in a white box on the left) can enter the Krebs cycle at various points through bidirectional teal and green arrows. At the bottom of the diagram, a red descending staircase represents the electron transport chain, with electrons (marked as “e⁻” in yellow sunburst symbols) cascading down four steps. Red curved arrows show the flow of electrons through the chain. At the base, the final reaction is shown: H₂O ← 2H⁺ + O₂ + e⁻, indicating that oxygen serves as the final electron acceptor to form water. This diagram effectively demonstrates how the body’s metabolism is highly integrated, with carbohydrates, fats, and proteins all ultimately converging on common pathways for energy production through the Krebs cycle and electron transport chain, while also showing the flexibility of metabolism to build up (anabolic, shown in green) or break down (catabolic, shown in teal) these molecules based on the body’s energy needs. [Return to Figure 16.4.4]
Report an Error
Did you find an error, typo, broken link, or other problem in the text? Please follow this link to the error reporting form to submit an error report to the authors.