3.2 Hormones, Behaviors, and Structural Inequalities
Hormones can influence sensory systems, the central nervous system, and output systems. Therefore, they affect the probability that a behavior will manifest in a specific context or situation. Importantly, certain behaviors can impact the level of hormone concentrations one produces, as demonstrated by the Dabbs (2000) study in which Italian soccer fans had lower concentrations of testosterone than Brazilian soccer fans after Brazil beat Italy in a soccer game. This difference was attributed to Italian fans feeling defeated and Brazilian fans feeling triumphant. Additionally, in both nonhuman animal models and human studies, higher levels of testosterone have been correlated with higher levels of aggressive behavior. Models using mice have shown that prenatal exposure to testosterone plays a role in brain organization and that brain organization interacts with current levels of testosterone to correlate with current aggressive behavior. It has been difficult to parse out hormone, behavior, and environment interactions in human studies. Additionally, most human studies examining the role of hormones and behavior have been conducted using White or affluent samples that do not represent everyone’s experiences (Harnett, 2020).
Marginalized communities experience disproportionate amounts of life stressors, such as poverty and discrimination. Ethnically/racially minoritized individuals experience racial/ethnic discrimination throughout the lifespan, resulting in chronic stress. This section addresses research contributing to the modeling of the pathway between experiences with poverty and racial/ethnic discrimination, chronic stress, and health and behavioral outcomes in people of color.
When in challenging or stressful situations, the steroid hormone, testosterone, which is derived from the HPG axis (see Figure 1a), and the glucocorticoid hormone, cortisol, which is derived from the HPA axis (see Figure 1b), become elevated. Cortisol is also involved in a negative feedback loop, which inhibits its production to help regulate one’s response to stress. This negative feedback loop is helpful because if too much stress is experienced, it can stop the excessive production of cortisol to keep the hormone in balance. Chronic stress or intense experiences with stress can make this negative feedback loop dysfunctional and stop it from inhibiting the overproduction of cortisol.
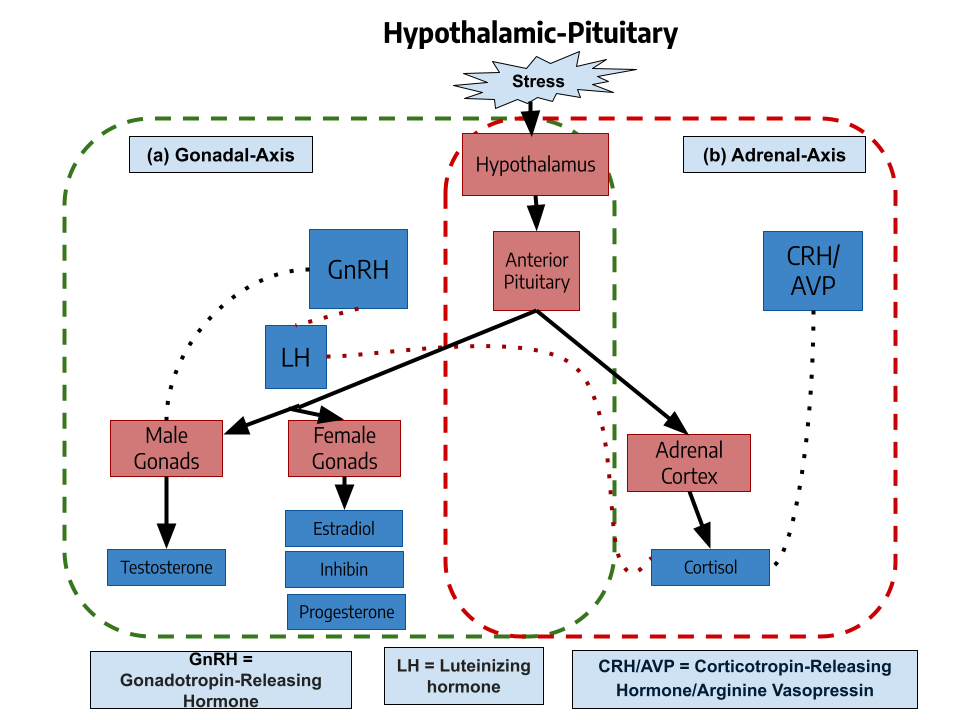
Figure 3.1. (a) The Hypothalamic-Pituitary-Gonadal (HPG) Axis. (b) The Hypothalamic-Pituitary-Adrenal (HPA) Axis [Image Description]
Experiencing stress also results in the corelease of testosterone and cortisol, which activates the HPG and HPA axes, an action that is referred to as coupling and that is marked by the release of another hormone, dehydroepiandrosterone (DHEA) (Marceau et al., 2014). Stressful life experiences due to poverty have been linked to HPG-HPA coupling (i.e., the release of testosterone, cortisol, and DHEA) in primarily impoverished White populations (McFarland & Hayward, 2014; Harnett, 2020). This research provides evidence for the effects of stressful life experiences on hormone production. A growing body of research is now showing links between life experience due to structural inequalities, hormone production, and one’s behavior (Harnett, 2020). For example, in a diverse sample of adolescents (56.5% adolescents of color), early stressful life experiences were found to be associated with dysregulating proportions of cortisol to DHEA, which in turn were related to higher levels of externalizing problems, particularly in boys (Lee et al., 2024). In addition, studies of Black families showed the transgenerational effect of Black mothers’ experiences with racism on their children’s stress hormones (Moody et. al, 2023). In this study, Black mothers’ experiences with discrimination were associated with higher levels of cortisol-testosterone coupling (i.e., a higher stress response) in their children (see Figure 2; Moody et al., 2023). Black children living in violent, under-resourced neighborhoods also show slower recovery from stress-induced events compared to their peers in less violent neighborhoods with more resources (Theall et al, 2017).
Perhaps surprisingly, low-income Mexican-origin youth living in more affluent and White neighborhoods showed higher levels of cortisol compared to those living in underserved neighborhoods with a greater number of people of Hispanic origin (Ip et al., 2024). This suggests that living in environments that are socially taxing and without cultural support, despite having more resources, can also affect one’s physiology. In summary, these findings point to the debilitating role of poverty and racism stressors on individuals’ ability to regulate their emotional responses due to heightened levels of cortisol and disruptions to the negative feedback loop that helps regulate stress response (Loman & Gunnar, 2010). This is why many refer to the effects of poverty and racism as being “under the skin.”

Figure 3.2. Evidence for the association between mothers’ experiences of racial discrimination across the lifetime and their offspring’s levels of testosterone and cortisol (From “Transgenerational effect of mothers’ experiences of discrimination on Black youths’ hormone coupling in response to laboratory stress,” by Moody et al., 2023, Research in Human Development, 20(1–2), 38) [Image Description]
Both emotional regulation and focus are needed for success in school (Raver, 2012) and, subsequently, in life. Structural inequalities (e.g., poverty and discrimination) that contribute to the marginalization of people of color have long-term physiological effects that perpetuate and increase inequalities in areas such as academic and job achievement.
Image Descriptions
Figure 3.1 Image Description. The image is an illustrative diagram showing two physiological axes: the Gonadal Axis and the Adrenal Axis. Each axis is enclosed in its own rectangle, marked in green for the Gonadal Axis on the left and red for the Adrenal Axis on the right. In the center top, a box labeled “Stress” connects to both axes. The Gonadal Axis section, on the left, includes the hypothalamus in a red box, which releases Gonadotropin-Releasing Hormone (GnRH) to the anterior pituitary, also in red. This in turn releases Luteinizing Hormone (LH) shown in blue, which affects the male and female gonads, represented by pink boxes. The male gonads release testosterone, and the female gonads release estradiol, inhibin, and progesterone. The Adrenal Axis section, on the right, shows the hypothalamus releasing Corticotropin-Releasing Hormone (CRH) / Arginine Vasopressin (AVP), which acts on the anterior pituitary to release ACTH. This influences the adrenal cortex, depicted in a pink box, to produce cortisol. At the bottom, a legend in a white rectangle provides the meanings of the abbreviations used. [Return to Figure 3.1]
Figure 3.2 Image Description. The image is a line graph with three lines representing different groups over four TSSC-C Time Points on the x-axis. The y-axis measures “LnCortisol” from 2.4 to 3.6. The blue line (Low Testosterone, Low EORD) begins at approximately 2.8, peaks at around 3.2, and ends at about 2.9. The red line (High Testosterone, Low EORD) starts at about 3.0, peaks near 3.4, and declines back to 3.0. The dark red line (High Testosterone, High EORD) begins at around 3.1, peaks at about 3.5, and concludes at 3.1. The graph shows a rise and fall trend for each line, with distinct peaks occurring around the third time point. A legend on the right indicates the line categories. Below the graph, there’s a figure caption explaining the data and abbreviations. Transcribed Text: High and low testosterone Youths’ cortisol-testosterone coupling moderated by Mothers’ experiences of racial discrimination. Note: TSST-C = Trier Social Stress Test for Children. LNCortisol = natural log transformed cortisol level. Testo = natural log transformed testosterone level. EORD = mothers’ experiences of racial discrimination. [Return to Figure 3.2]
Media Attributions
- Hypthalamic Pituitary Pathway © Vivian Hoang is licensed under a Public Domain license
- Screenshot 2025-07-01 at 2.40.03 PM © Moody et al
