Chapter 10. Blood Vessels
10.2 Blood Flow, Blood Pressure, and Resistance
Learning Objectives
By the end of this section, you will be able to:
- Diagram and describe how blood pressure (BP) changes as blood flows from the aorta to the venae cavae
- Distinguish between systolic pressure, diastolic pressure, pulse pressure, and mean arterial pressure (MAP)
- Calculate pulse pressure and MAP when given systolic and diastolic atrial pressures and explain why MAP is not a simple average of the systolic and diastolic pressures
- Explain how changes in cardiac output, compliance, blood volume, and total peripheral resistance can change MAP
- Discuss factors affecting blood flow and pressure in the venous system
- Explain the difference between the cross-sectional area of a single blood vessel and the total cross-sectional area of a group of blood vessels, as well as how that relates to blood pressure and blood flow throughout the body
Blood flow refers to the movement of blood through a vessel, tissue, or organ, and is usually expressed in terms of volume of blood per unit of time. It is initiated by the contraction of the ventricles of the heart. If we consider the entire cardiovascular system, blood flow equals cardiac output. Ventricular contraction ejects blood into the major arteries, resulting in flow from regions of higher pressure to regions of lower pressure. This section discusses a number of critical variables that contribute to blood flow throughout the body. It also discusses the factors that impede or slow blood flow, a phenomenon known as resistance.
As noted earlier, hydrostatic pressure is the force exerted by a fluid due to gravitational pull, usually against the wall of the container in which it is located. One form of hydrostatic pressure is blood pressure, the force exerted by blood upon the walls of the blood vessels or the chambers of the heart. Blood pressure may be measured in both the systemic and pulmonary circulation; however, the term blood pressure without any specific descriptors typically refers to systemic arterial blood pressure—that is, the pressure of blood flowing in the arteries of the systemic circulation. In clinical practice, this pressure is measured in mm Hg and is usually obtained using the brachial artery of the arm.
Components of Arterial Blood Pressure
Arterial blood pressure in the larger vessels varies between systolic and diastolic pressures. Pulse pressure and mean arterial pressure are calculated values based upon the systolic and diastolic pressures (Figure 10.2.1).
Systolic and Diastolic Pressures
When systemic arterial blood pressure is measured, it is recorded as a ratio of two numbers (e.g., 120/80 is a normal adult blood pressure), expressed as systolic pressure over diastolic pressure, with the standard unit of measurement being millimeters of mercury (mm Hg). The systolic pressure is the higher value (typically around 120 mm Hg) and reflects the arterial pressure resulting from the ejection of blood during ventricular contraction, or systole. The diastolic pressure is the lower value (usually about 80 mm Hg) and represents the arterial pressure of blood during ventricular relaxation, or diastole.
Pulse Pressure
As shown in Figure 20.2.1, the difference between the systolic pressure and the diastolic pressure is the pulse pressure. For example, an individual with a systolic blood pressure (BP) of 120 mm Hg and a diastolic BP of 80 mm Hg would have a pulse pressure of 40 mm Hg.
Pulse pressure = systolic BP – diastolic BP
Generally, a pulse pressure should be at least 25% of the systolic pressure. A pulse pressure below this level is described as low or narrow. This may occur, for example, in patients with a low stroke volume, which may be seen in congestive heart failure, stenosis of the aortic valve, or significant blood loss following trauma. In contrast, a high or wide pulse pressure is common in healthy people following strenuous exercise, when their resting pulse pressure of 30 to 40 mm Hg may increase temporarily to 100 mm Hg as stroke volume increases. A persistently high pulse pressure at or above 100 mm Hg may indicate excessive resistance in the arteries and can be caused by a variety of disorders such as atherosclerosis. Chronic high resting pulse pressures can degrade the heart, brain, and kidneys, and warrant medical treatment.
Mean Arterial Pressure
Mean arterial pressure (MAP) represents the “average” pressure of blood in the arteries, that is, the average force driving blood into vessels that serve the tissues. Mean is a statistical concept and is calculated by taking the sum of the values divided by the number of values. The mathematical formula for MAP divides the pulse pressure by three rather than two because the heart spends more time in diastole than it does in systole. Figure 10.2.1 demonstrates how MAP is not simply midway between systolic BP and diastolic BP, rather it is closer to diastolic BP. Although complicated to measure directly and complicated to calculate, MAP can be approximated by adding the diastolic pressure to one-third of the pulse pressure or systolic pressure minus the diastolic pressure:
MAP = diastolic BP + [(systolic BP-diastolic BP) / 3]
In Figure 10.2.1, this value is approximately 80 + (120 − 80) / 3, or 93.33. Normally, the MAP falls within the range of 70 to 110 mm Hg. If the value falls below 60 mm Hg for an extended time, blood pressure will not be high enough to ensure circulation to and through the tissues, which results in ischemia, or insufficient blood flow. A condition called hypoxia, inadequate oxygenation of tissues, commonly accompanies ischemia. The term hypoxemia refers to low levels of oxygen in systemic arterial blood. Neurons are especially sensitive to hypoxia and may die or be damaged if blood flow and oxygen supplies are not quickly restored.
Pulse
After blood is ejected from the heart, elastic fibers in the arteries help maintain a high-pressure gradient as they expand to accommodate the blood, then recoil to keep pressure on the blood. This expansion and recoiling effect, known as the pulse, can be palpated manually or measured electronically. Although the effect diminishes as the distance from the heart increases, elements of the systolic and diastolic components of the pulse are still evident down to the level of the arterioles.
Because pulse indicates heart rate, it is measured clinically to provide clues to a patient’s state of health. It is recorded as beats per minute. Both the rate and the strength of the pulse are important clinically. A high or irregular pulse rate can be caused by physical activity or other temporary factors, but it may also indicate a heart condition. The pulse strength indicates the strength of ventricular contraction and cardiac output. If the pulse is strong, then systolic pressure is high. If it is weak, systolic pressure has fallen, and medical intervention may be warranted.
Pulse can be palpated manually by lightly pressing the tips of the fingers across an artery that runs close to the body surface. While this procedure is normally performed using the radial artery in the wrist or the common carotid artery in the neck, any superficial artery that can be palpated may be used (Figure 10.2.2). Common sites to find a pulse include temporal and facial arteries in the head, brachial arteries in the upper arm, femoral arteries in the thigh, popliteal arteries behind the knees, posterior tibial arteries near the medial tarsal regions, and dorsalis pedis arteries in the feet. A variety of commercial electronic devices are also available to measure pulse.
Measurement of Blood Pressure
Blood pressure is one of the critical parameters measured on virtually every patient in every healthcare setting. The technique used today was developed more than 100 years ago by a pioneering Russian physician, Dr. Nikolai Korotkoff. Turbulent blood flow through the vessels can be heard as a soft ticking sound while measuring blood pressure; these sounds are known as Korotkoff sounds. The technique of measuring blood pressure requires the use of a sphygmomanometer (a blood pressure cuff attached to a measuring device) and a stethoscope. The technique is as follows:
- The clinician wraps an inflatable cuff tightly around the patient’s arm at about the level of the heart.
- The clinician squeezes a rubber pump to inject air into the cuff, raising pressure around the artery and temporarily cutting off blood flow into the patient’s arm.
- The clinician places the stethoscope on the patient’s antecubital (anterior elbow) region and, while gradually allowing air within the cuff to escape, listens for the Korotkoff sounds.
Although there are five recognized Korotkoff sounds, only two are normally recorded. Initially, no sounds are heard since there is no blood flowing through the vessels, but as air pressure steadily drops, the cuff relaxes, and blood flow becomes pulsatile (turbulent) as it is pushed through the opening vessel. As shown in Figure 10.2.3, the first sound heard through the stethoscope—the first Korotkoff sound—indicates systolic blood pressure. The clinician measuring the blood pressure will continue to hear tapping sounds for a time, but as more air is released from the cuff, the blood vessel lumen completely opens, and blood is eventually able to flow freely through the brachial artery. Once blood flows freely, all sounds disappear. The point at which the sound disappears is recorded as the patient’s diastolic pressure. Thus, the diastolic pressure is recorded when a clinician expects to hear another sound but does not.
The majority of hospitals and clinics have automated equipment for measuring blood pressure that works on the same principles. An even more recent innovation is a small instrument that wraps around a patient’s wrist. The patient then holds the wrist over the heart while the device measures blood flow and records pressure.
Variables Affecting Blood Flow and Blood Pressure
The following four variables influence blood flow and blood pressure:
- Cardiac output
- Compliance
- Blood volume
- Total peripheral resistance
Recall that blood moves from higher pressure to lower pressure. It is pumped from the heart into the arteries at high pressure. Since pressure in the veins is normally relatively low, for blood to flow back into the heart, the pressure in the atria during atrial diastole must be even lower. It normally approaches zero, except when the atria contract (Figure 10.2.1).
Cardiac Output
Cardiac output is the measurement of blood flow from the heart through the ventricles, and is usually measured in liters per minute. Any factor that causes cardiac output to increase, by elevating heart rate or stroke volume or both, will elevate blood pressure and promote blood flow. These factors include sympathetic stimulation, the catecholamines epinephrine and norepinephrine, thyroid hormones, and increased calcium ion levels. Conversely, any factor that decreases cardiac output, by decreasing heart rate or stroke volume or both, will decrease arterial pressure and blood flow. These factors include parasympathetic stimulation, elevated or decreased potassium ion levels, decreased calcium levels, anoxia, and acidosis.
Compliance
Compliance is the ability of any compartment to expand to accommodate increased content. A metal pipe, for example, is not compliant, whereas a balloon is. The greater the compliance of an artery, the more effectively it is able to expand to accommodate surges in blood flow without increased resistance or blood pressure. Veins are more compliant than arteries and can expand to hold more blood. When vascular disease causes stiffening of arteries, compliance is reduced and resistance to blood flow is increased. The result is more turbulence, higher pressure within the vessel, and reduced blood flow. This increases the work of the heart.
Blood Volume
Blood volume, blood pressure, and blood flow are directly proportional to one another. Water may merely trickle along a creek bed in a dry season, but rush quickly and under great pressure after a heavy rain. Similarly, as blood volume decreases, pressure and flow decrease. As blood volume increases, pressure and flow increase.
Under normal circumstances, blood volume varies little. Low blood volume, called hypovolemia, may be caused by bleeding, dehydration, vomiting, severe burns, or some medications used to treat hypertension. It is important to recognize that other regulatory mechanisms in the body are so effective at maintaining blood pressure that an individual may be asymptomatic until 10% to 20% of the blood volume has been lost. Treatment typically includes intravenous fluid replacement.
Hypervolemia, excessive fluid volume, may be caused by retention of water and sodium, as seen in patients with heart failure, liver cirrhosis, some forms of kidney disease, hyperaldosteronism, and some glucocorticoid steroid treatments. Restoring homeostasis in these patients depends upon reversing the condition that triggered the hypervolemia.
Total Peripheral Resistance
Total peripheral resistance (TPR), also known as systemic vascular resistance, is essentially the friction or force that blood encounters as it passes through the systemic blood vessels that resists flow. The three most important factors affecting TPR are blood viscosity, vessel length and vessel diameter and are each considered below.
Blood viscosity is the thickness of fluids and it affects fluid flow. Clean water, for example, is less viscous than mud and flows more easily than mud. The viscosity of blood is directly proportional to resistance and inversely proportional to flow; therefore, any condition that causes viscosity to increase will also increase resistance and decrease flow. For example, imagine sipping milk, then a milkshake, through the same size straw. You experience more resistance and therefore less flow from the milkshake compared to the milk. Conversely, any condition that causes viscosity to decrease (such as when the milkshake melts) will decrease resistance and increase flow.
Normally the viscosity of blood does not change over short periods of time. The two primary determinants of blood viscosity are the formed elements and plasma proteins. Since the vast majority of formed elements are erythrocytes, any condition affecting erythropoiesis, such as polycythemia or anemia, can alter viscosity. Since most plasma proteins are produced by the liver, any condition affecting liver function can also change the viscosity slightly and therefore decrease blood flow. Liver abnormalities include hepatitis, cirrhosis, alcohol damage, and drug toxicities. While leukocytes and platelets are normally a small component of the formed elements, there are some rare conditions in which severe overproduction can impact viscosity as well.
Blood vessel length is directly proportional to its resistance: the longer the vessel, the greater the resistance and the lower the flow. As with blood volume, this makes intuitive sense, since the increased surface area of the vessel wall will impede the flow of blood. There is friction between the flowing blood and vessel wall. Likewise, if the vessel is shortened, the resistance will decrease and flow will increase.
The length of our blood vessels increases throughout childhood as we grow, of course, but is unchanging in adults under normal physiological circumstances. Further, the distribution of vessels is not the same in all tissues. Adipose tissue does not have an extensive vascular supply. One pound of adipose tissue contains approximately 200 miles of vessels, whereas skeletal muscle contains more than twice that. Overall, vessels decrease in length only during loss of mass or amputation. An individual weighing 150 pounds has approximately 60,000 miles of vessels in the body. Gaining about 10 pounds adds from 2000 to 4000 miles of vessels, depending upon the nature of the gained tissue (e.g., muscle or fat). One of the great benefits of weight reduction is the reduced stress to the heart, which does not have to overcome the resistance of as many miles of vessels.
In contrast to length, blood vessel diameter changes throughout the body, according to the type of vessel, as we discussed earlier. The diameter of any given vessel may also change frequently throughout the day in response to neural and chemical signals that trigger vasodilation and vasoconstriction. The vascular tone of the vessel is the contractile state of the smooth muscle and the primary determinant of diameter, and thus of resistance and flow. The effect of vessel diameter on resistance is inverse: Given the same volume of blood, an increased diameter means there is less blood contacting the vessel wall, thus there is less friction and less resistance, subsequently increasing flow. A decreased diameter means more of the blood contacts the vessel wall, and resistance increases, subsequently decreasing flow.
The influence of lumen diameter on resistance is dramatic: A slight increase or decrease in diameter causes a dramatic decrease or increase in resistance. This is because resistance is inversely proportional to the radius of the blood vessel (one-half of the vessel’s diameter) raised to the fourth power (R = 1/r4). This means, for example, that if an artery or arteriole constricts to one-half of its original radius, the resistance to flow will increase 16 times. And if an artery or arteriole dilates to twice its initial radius, then resistance in the vessel will decrease to 1/16 of its original value and flow will increase 16 times.
A Mathematical Approach to Factors Affecting Blood Flow
Jean Louis Marie Poiseuille was a French physician and physiologist who devised a mathematical equation describing blood flow and its relationship to known parameters. The same equation also applies to engineering studies of the flow of fluids. Although understanding the math behind the relationships among the factors affecting blood flow is not necessary to understand blood flow, it can help solidify an understanding of their relationships. Please note that even if the equation looks intimidating, breaking it down into its components and following the relationships will make these relationships clearer, even if you are weak in math. Focus on the three critical variables: radius (r), vessel length (λ), and viscosity (η).
Poiseuille’s equation is as follows:
- π is the Greek letter pi, used to represent the mathematical constant that is the ratio of a circle’s circumference to its diameter. It may commonly be represented as 3.14, although the actual number extends to infinity.
- ΔP represents the difference in pressure.
- r4 is the radius (one-half of the diameter) of the vessel to the fourth power.
- η is the Greek letter eta and represents the viscosity of the blood.
- λ is the Greek letter lambda and represents the length of a blood vessel.
One of several things this equation allows us to do is calculate the resistance in the vascular system. Normally this value is extremely difficult to measure, but it can be calculated from this known relationship:
If we rearrange this slightly, we get:
Then by substituting Pouseille’s equation for blood flow, we have:
By examining this equation, you can see that there are only three variables: viscosity, vessel length, and radius, since 8 and π are both constants. The important thing to remember is this: two of these variables, viscosity and vessel length, will change slowly in the body. Only one of these factors, the radius, can be changed rapidly by vasoconstriction and vasodilation, thus dramatically impacting resistance and flow. Further, small changes in the radius will greatly affect flow, since it is raised to the fourth power in the equation.
We have briefly considered how cardiac output and blood volume impact blood flow and pressure; the next step is to see how the other variables (contraction, vessel length, and viscosity) articulate with Pouseille’s equation and what they can teach us about the impact on blood flow.
The Roles of Vessel Diameter and Total Area in Blood Flow and Blood Pressure
Recall that we classified arterioles as resistance vessels, because given their small lumen, they dramatically slow the flow of blood from arteries. In fact, arterioles are the site of greatest resistance in the entire vascular network. This may seem surprising, given that capillaries have a smaller size. How can this phenomenon be explained?
Figure 10.2.4 compares vessel diameter, total cross-sectional area, average blood pressure, and blood velocity through the systemic vessels. Notice in part (b) that the total cross-sectional area of the body’s capillary beds is far greater than any other type of vessel. In parts (a) and (b), one can see that although the diameter of an individual capillary is significantly smaller than the diameter of an arteriole, there are vastly more capillaries in the body than there are other types of blood vessels.
Part (c) shows that blood pressure drops unevenly as blood travels from arteries to arterioles, capillaries, venules, and veins, and encounters greater resistance. However, the site of the most precipitous drop in blood pressure, and the site of greatest resistance to blood flow, is within the arterioles. This explains why vasodilation and vasoconstriction of arterioles play more significant roles in regulating blood pressure than do the vasodilation and vasoconstriction of other vessels.
Part (d) shows that the velocity (speed) of blood flow decreases dramatically as the blood moves from arteries to arterioles to capillaries. This slow flow rate allows more time for the exchange of substances between the blood and cells to occur. As blood flows through the veins, the rate of velocity increases, as blood is returned to the heart.
Disorders of the Cardiovascular System – Arteriosclerosis
Compliance allows an artery to expand when blood is pumped through it from the heart, and then to recoil after the surge has passed. This helps promote blood flow. In arteriosclerosis, compliance is reduced, and pressure and resistance within the vessel increase. This is a leading cause of hypertension and coronary heart disease, as it forces the heart to work harder to generate a pressure great enough to overcome the resistance.
Arteriosclerosis begins with injury to the endothelium of an artery, which may be caused by irritation from high blood glucose, infection, tobacco use, excessive blood lipids, and other factors. Artery walls that are constantly stressed by blood flowing at high pressure are also more likely to be injured—which means that hypertension can promote arteriosclerosis, as well as result from it.
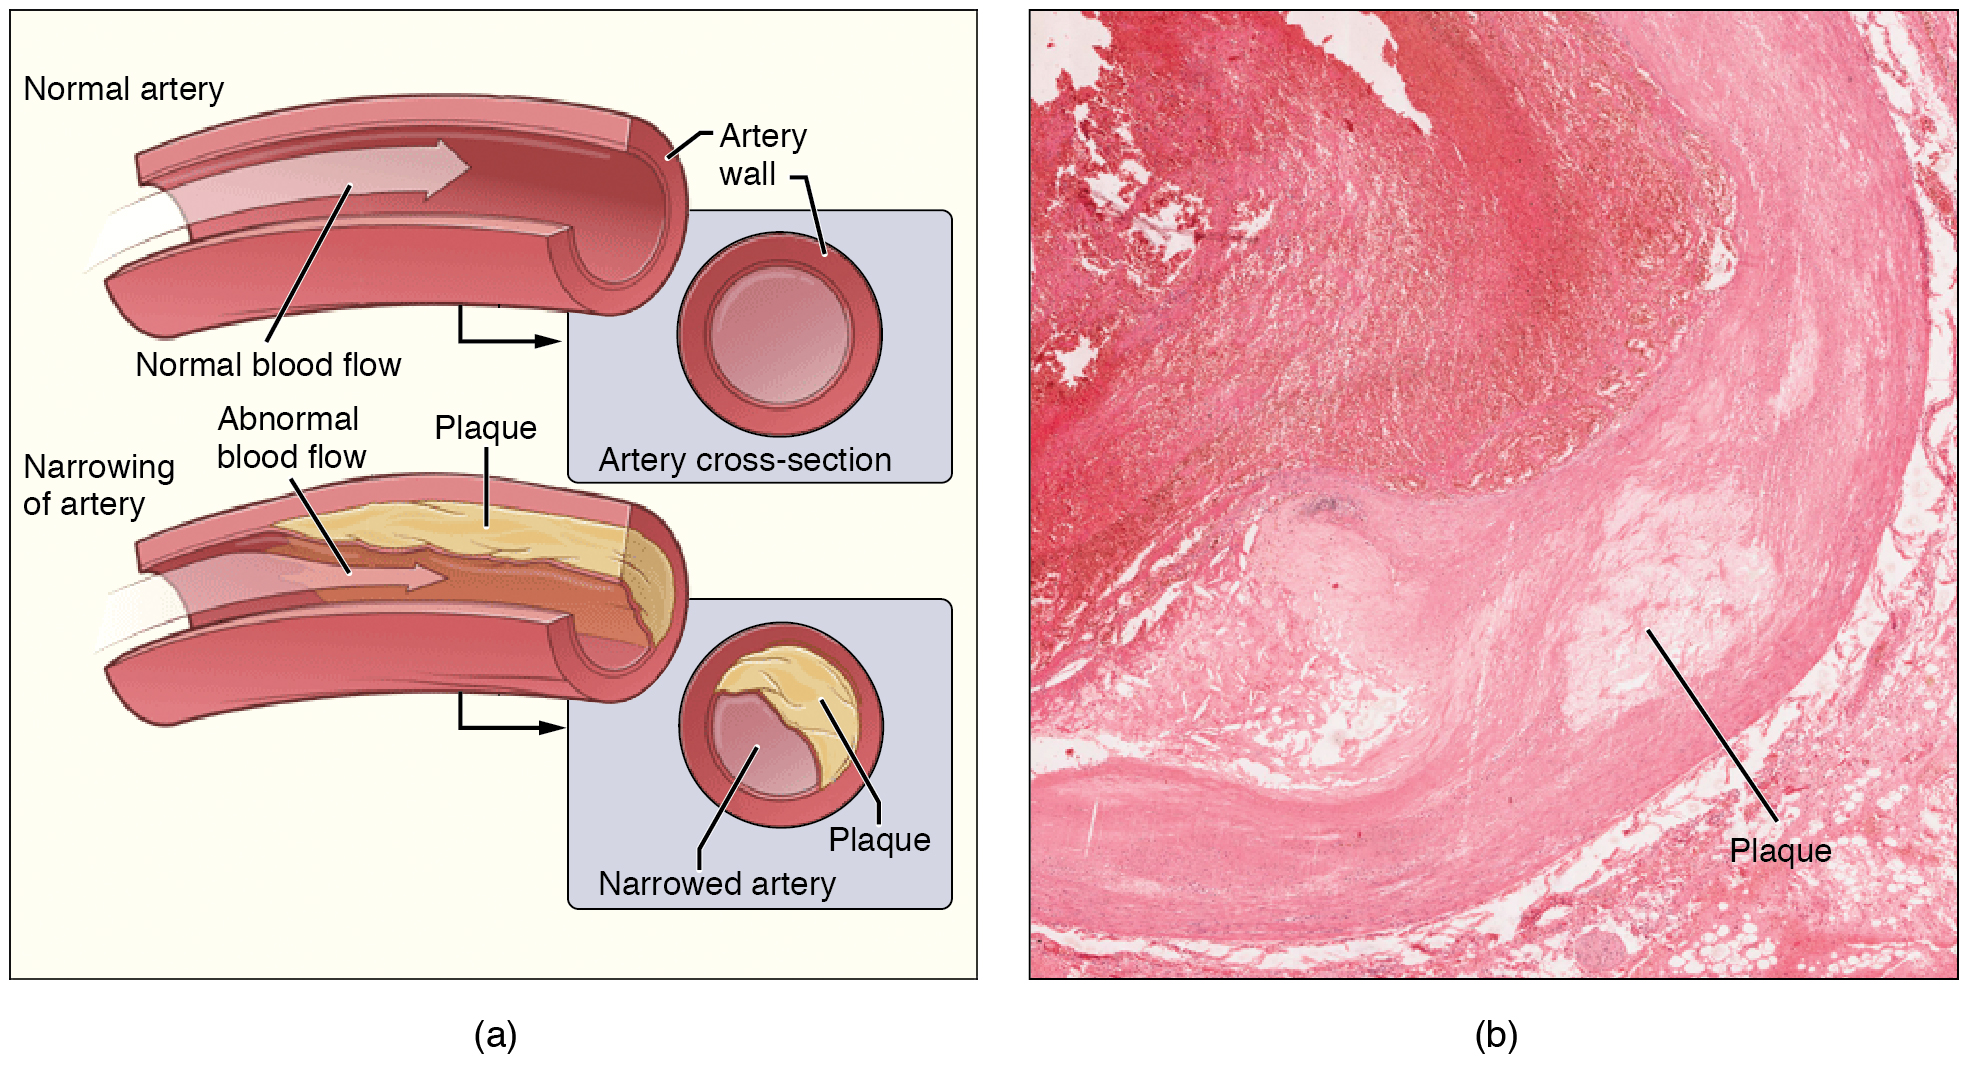
Recall that tissue injury causes inflammation. As inflammation spreads into the artery wall, it weakens and scars it, leaving it stiff (sclerotic). As a result, compliance is reduced. Moreover, circulating triglycerides and cholesterol can seep between the damaged lining cells and become trapped within the artery wall, where they are frequently joined by leukocytes, calcium, and cellular debris. Eventually, this buildup, called plaque, can narrow arteries enough to impair blood flow. The term for this condition, atherosclerosis (“athero-” meaning “porridge”) describes the mealy deposits (Figure 10.2.5).
Sometimes a plaque can rupture, causing microscopic tears in the artery wall that allow blood to leak into the tissue on the other side. When this happens, platelets rush to the site to clot the blood. This clot can further obstruct the artery and—if it occurs in a coronary or cerebral artery—cause a sudden heart attack or stroke. Alternatively, plaque can break off and travel through the bloodstream as an embolus until it blocks a more distant, smaller artery.
Even without total blockage, vessel narrowing leads to ischemia—reduced blood flow—to the tissue region “downstream” of the narrowed vessel. Ischemia in turn leads to hypoxia—decreased supply of oxygen to the tissues. Hypoxia involving cardiac muscle or brain tissue can lead to cell death and severe impairment of brain or heart function.
A major risk factor for both arteriosclerosis and atherosclerosis is advanced age, as the conditions tend to progress over time. Arteriosclerosis is normally defined as the more generalized loss of compliance, or “hardening of the arteries,” whereas atherosclerosis is a more specific term for the buildup of plaque in the walls of the vessel and is a specific type of arteriosclerosis. There is also a distinct genetic component, and pre-existing hypertension and/or diabetes also greatly increase the risk. However, obesity, poor nutrition, lack of physical activity, and tobacco use all are major risk factors.
Treatment includes lifestyle changes, such as weight loss, smoking cessation, regular exercise, and an adoption of a diet low in sodium and saturated fats. Medications to reduce cholesterol and blood pressure may be prescribed. For blocked coronary arteries, surgery is warranted. In angioplasty, a catheter is inserted into the vessel at the point of narrowing, and a second catheter with a balloon-like tip is inflated to widen the opening. To prevent subsequent collapse of the vessel, a small mesh tube called a stent is often inserted. In an endarterectomy, plaque is surgically removed from the walls of a vessel. This operation is typically performed on the carotid arteries of the neck, which are a prime source of oxygenated blood for the brain. In a coronary bypass procedure, a non-vital superficial vessel from another part of the body (often the great saphenous vein) or a synthetic vessel is inserted to create a path around the blocked area of a coronary artery.
Venous System
The pumping action of the heart propels the blood into the arteries, from an area of higher pressure toward an area of lower pressure. If blood is to flow from the veins back into the heart, the pressure in the veins must be greater than the pressure in the atria of the heart. Two factors help maintain this pressure gradient between the veins and the heart. First, the pressure in the atria during diastole is very low, often approaching zero when the atria are relaxed (atrial diastole). Second, two physiologic “pumps” increase pressure in the venous system. The use of the term “pump” implies a physical device that speeds flow. These physiological pumps are less obvious.
Skeletal Muscle Pump
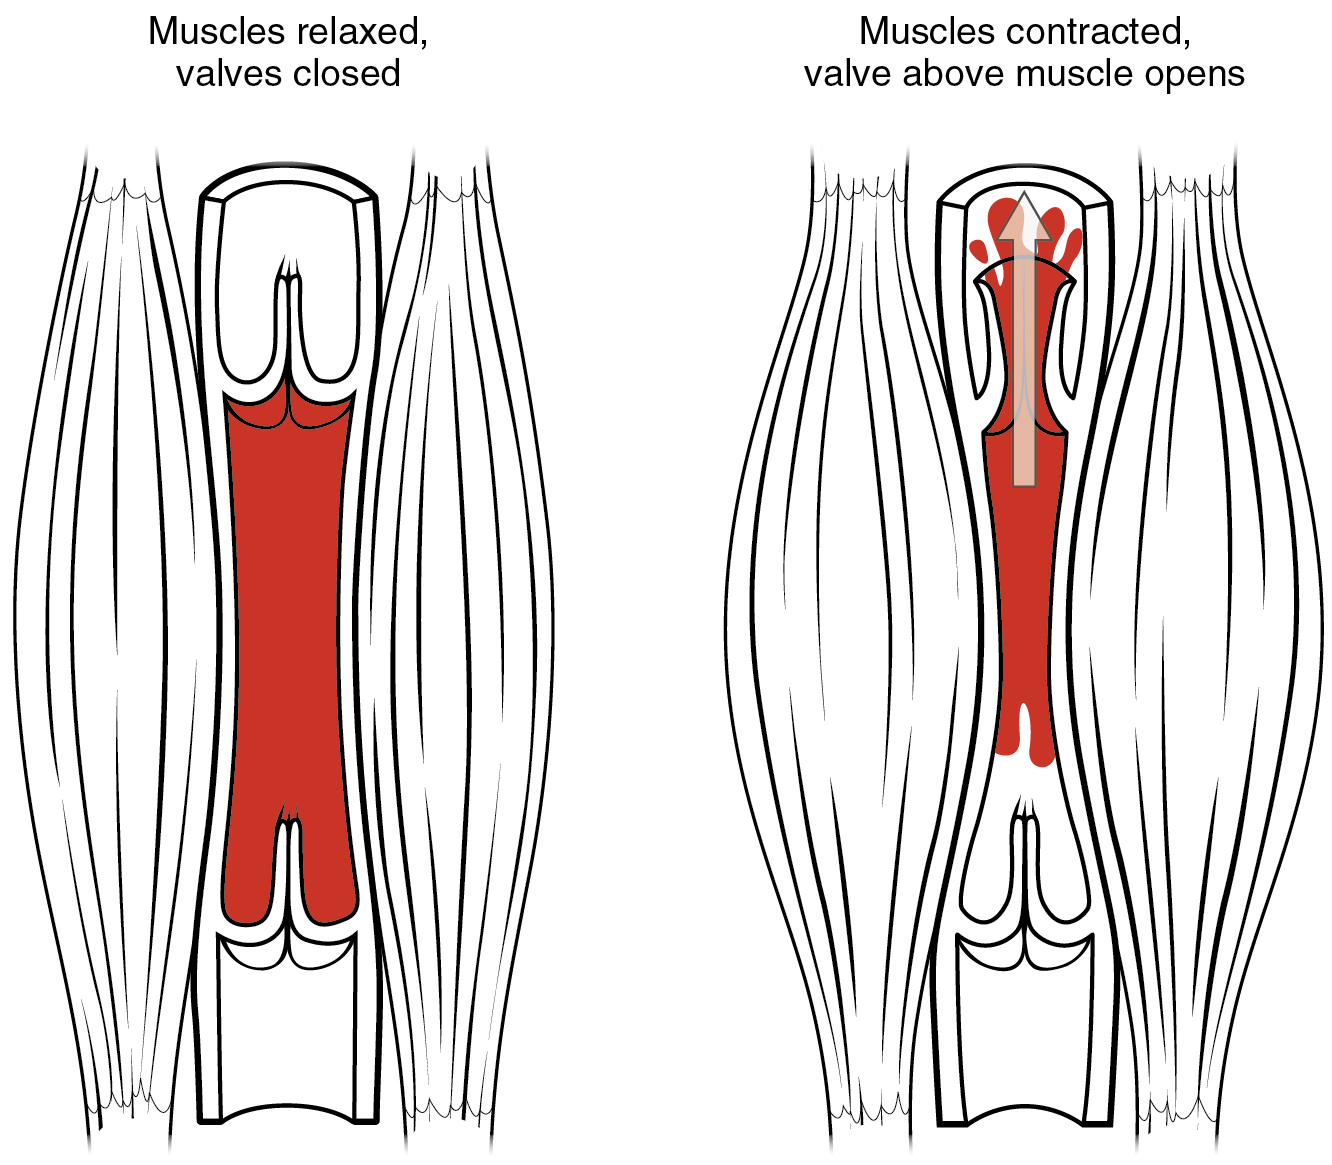
In many body regions, the pressure within the veins can be increased by the contraction of the surrounding skeletal muscle. This mechanism, known as the skeletal muscle pump (Figure 10.2.6), helps the lower-pressure veins counteract the force of gravity, increasing pressure to move blood back to the heart. As leg muscles contract, for example during walking or running, they exert pressure on nearby veins with their numerous one-way valves. This increased pressure causes blood to flow upward, opening valves superior to the contracting muscles so blood flows through. Simultaneously, valves inferior to the contracting muscles close; thus, blood should not seep back downward toward the feet. Military recruits are trained to flex their legs slightly while standing at attention for prolonged periods. Failure to do so may allow blood to pool in the lower limbs rather than returning to the heart. Consequently, the brain will not receive enough oxygenated blood, and the individual may lose consciousness.
Respiratory Pump
The respiratory pump aids blood flow through the veins of the thorax and abdomen. During inhalation, the volume of the thorax increases, largely through the contraction of the diaphragm, which moves downward and compresses the abdominal cavity. The elevation of the chest caused by the contraction of the external intercostal muscles also contributes to the increased volume of the thorax. The volume increase causes air pressure within the thorax to decrease, allowing us to inhale. Additionally, as air pressure within the thorax drops, blood pressure in the thoracic veins also decreases, falling below the pressure in the abdominal veins. This causes blood to flow along its pressure gradient from veins outside the thorax, where pressure is higher, into the thoracic region, where pressure is now lower. This in turn promotes the return of blood from the thoracic veins to the atria. During exhalation, when air pressure increases within the thoracic cavity, pressure in the thoracic veins increases, speeding blood flow into the heart while valves in the veins prevent blood from flowing backward from the thoracic and abdominal veins.
Pressure Relationships in the Venous System
Although vessel diameter increases from the smaller venules to the larger veins and eventually to the venae cavae (singular vena cava), the total cross-sectional area actually decreases (Figure 10.2.6). The individual veins are larger in diameter than the venules, but their total number is much lower, so their total cross-sectional area is also lower.
Also notice that, as blood moves from venules to veins, the average blood pressure drops (Figure 10.2.6), but the blood velocity actually increases (Figure 10.2.6). This pressure gradient drives blood back toward the heart. Again, the presence of one-way valves and the skeletal muscle and respiratory pumps contribute to this increased flow. Since approximately 64% of the total blood volume resides in systemic veins, any action that increases the flow of blood through the veins will increase venous return to the heart. Maintaining vascular tone within the veins prevents the veins from merely distending, dampening the flow of blood, and as you will see, vasoconstriction actually enhances the flow.
The Role of Venoconstriction in Resistance, Blood Pressure, and Flow
As previously discussed, vasoconstriction of an artery or arteriole decreases the radius, increasing resistance and pressure, but decreasing flow. Venoconstriction, on the other hand, has a very different outcome. The walls of veins are thin but irregular; thus, when the smooth muscle in those walls constricts, the lumen becomes more rounded. The more rounded the lumen, the less surface area the blood encounters, and the less resistance the vessel offers. Vasoconstriction increases pressure within a vein as it does in an artery, but in veins, the increased pressure increases flow. Recall that the pressure in the atria, into which the venous blood will flow, is very low, approaching zero for at least part of the relaxation phase of the cardiac cycle. Thus, venoconstriction increases the return of blood to the heart. Another way of stating this is that venoconstriction increases the preload or stretch of the cardiac muscle and increases contraction.
Section Review
Blood flow is the movement of blood through a vessel, tissue, or organ, whereas resistance refers to factors that impede or slow blood flow. Blood pressure is the force that blood exerts upon the walls of the blood vessels or chambers of the heart. The components of blood pressure include systolic pressure (resulting from ventricular contraction) and diastolic pressure (resulting from ventricular relaxation). Pulse pressure is the difference between systolic and diastolic measures. Mean arterial pressure is the “average” pressure of blood in the arterial system that drives blood into the tissues. MAP is calculated by adding the diastolic pressure to one-third of the pulse pressure.
The variables affecting blood flow and blood pressure in the systemic circulation are cardiac output, compliance, blood volume, and total peripheral resistance. In the arterial system, vasodilation and vasoconstriction of the arterioles have significant impacts on systemic blood pressure, where slight vasodilation greatly decreases resistance and increases flow, and slight vasoconstriction greatly increases resistance and decreases flow. In the arterial system, as resistance increases, blood pressure increases and flow decreases. In the venous system, constriction increases blood pressure as it does in arteries; but because it causes the vessel lumen to become more rounded, it actually decreases resistance and increases blood flow. Although less important than arterial vasoconstriction, venoconstriction works with the skeletal muscle pump, the respiratory pump, and their valves to promote venous return to the heart.
Review Questions
Critical Thinking Questions
Glossary
- blood flow
- movement of blood through a vessel, tissue, or organ that is usually expressed in terms of volume per unit of time
- blood pressure
- force exerted by the blood against the wall of a vessel or heart chamber; can be described with the more generic term hydrostatic pressure
- blood vessel diameter
- the distance between the opposite inside walls of a blood vessel, which increases with vasodilation and decreases with vasoconstriction
- blood vessel length
- the distance of a blood vessel or blood vessels from end to end; a longer blood vessel reduces blood flow more than a shorter vessel
- blood viscosity
- the thickness of a fluid, where a high viscosity fluid is thicker than a low viscosity fluid
- compliance
- degree to which a blood vessel can stretch as opposed to being rigid
- diastolic pressure
- lower number recorded when measuring arterial blood pressure; represents the minimal value corresponding to the pressure that remains during ventricular relaxation
- hypervolemia
- abnormally high levels of fluid and blood within the body
- hypovolemia
- abnormally low levels of fluid and blood within the body
- hypoxia
- insufficient oxygen supply to the tissues
- ischemia
- reduced blood flow to the tissues
- Korotkoff sounds
- noises created by turbulent blood flow through the vessels
- mean arterial pressure (MAP)
- average driving force of blood to the tissues; approximated by taking diastolic pressure and adding 1/3 of pulse pressure
- pulse
- alternating expansion and recoil of an artery as blood moves through the vessel; an indicator of heart rate
- pulse pressure
- difference between the systolic and diastolic pressures
- resistance
- any condition or parameter that slows or counteracts the flow of blood
- respiratory pump
- increase in the volume of the thorax during inhalation that decreases air pressure, enabling venous blood to flow into the thoracic region, then exhalation increases pressure, moving blood into the atria
- skeletal muscle pump
- effect of increasing blood pressure within veins by compression of the vessel caused by the contraction of nearby skeletal muscle
- sphygmomanometer
- blood pressure cuff attached to a device that measures blood pressure
- systolic pressure
- larger number recorded when measuring arterial blood pressure; represents the maximum value during ventricular contraction
- total peripheral resistance (TPR)
- the friction or force that blood encounters as it passes through the systemic blood vessels that resists flow (also systemic vascular resistance)
- vascular tone
- contractile state of smooth muscle in a blood vessel
Glossary Flashcards
This work, Human Physiology, is adapted from Anatomy & Physiology by OpenStax, licensed under CC BY. This edition, with revised content and artwork, is licensed under CC BY-SA except where otherwise noted.
Images from Anatomy & Physiology by OpenStax are licensed under CC BY except where otherwise noted.
Access the original for free at OpenStax.
Image Descriptions
Figure 10.2.1. This graph illustrates how blood pressure changes as blood flows through different types of vessels in the cardiovascular system, from the aorta through to the venae cavae. The vertical axis displays pulse pressure measured in millimeters of mercury (mm Hg) ranging from 0 to 120, while the horizontal axis shows the progression through vessel types: aorta, elastic arteries, muscular arteries, arterioles, capillaries, venules, medium and large veins, and venae cavae. The red pulsatile waveform at the left shows dramatic oscillations between systolic pressure (peaks around 110-120 mm Hg) and diastolic pressure (troughs around 75-80 mm Hg) in the aorta and large arteries, representing the rhythmic pumping action of the heart. Gray lines track the systolic pressure (upper boundary), mean arterial pressure (middle line staying relatively constant around 90-95 mm Hg through the arterial system), and diastolic pressure (lower boundary). The pulse pressure amplitude gradually decreases as blood moves through elastic and muscular arteries, then shows a marked reduction at the arterioles where the pulsatile flow becomes nearly continuous. Beyond the arterioles, the graph transitions to a smooth declining curve (shifting from red through purple to blue) as pressure drops steeply through capillaries (around 30 mm Hg), continues falling through venules and veins (around 10-15 mm Hg), and approaches nearly zero in the venae cavae. This visualization effectively demonstrates how arterial elasticity dampens pulsatile flow, how arterioles serve as the primary resistance vessels causing a major pressure drop, and how the venous system operates as a low-pressure reservoir for blood return to the heart. [Return to Figure 10.2.1]
Figure 10.2.2. This anatomical diagram depicts a front-facing female figure with labeled pulse points where major arteries can be palpated for clinical assessment. Black dots mark each arterial location with corresponding labels and connecting lines. Starting from the head, the temporal artery is indicated on the temple region, while the facial artery and common carotid artery are marked on the face and neck respectively. Moving down the upper body, the brachial artery is located on the inner upper arm, and the radial artery is positioned on the wrist near the thumb side. The femoral artery is marked in the groin area where the thigh meets the torso. In the lower extremities, the popliteal artery is indicated behind the knee, the posterior tibial artery is shown near the inner ankle, and the dorsalis pedis artery is marked on the top of the foot. These pulse points represent locations where arteries run close enough to the body surface that their pulsations can be felt manually, making them clinically important sites for assessing blood flow, taking vital signs, and evaluating cardiovascular health. The diagram provides a clear anatomical reference for healthcare providers and students learning to locate and assess peripheral pulses throughout the body. [Return to Figure 10.2.2]
Figure 10.2.3. This diagram illustrates the auscultatory method of measuring blood pressure, showing the relationship between cuff pressure, arterial pressure, and Korotkoff sounds over time. The upper portion displays a graph with pressure measured in millimeters of mercury (mm Hg) on the vertical axis ranging from 40 to 140, and time progressing along the horizontal axis. A red oscillating waveform represents the actual arterial blood pressure cycling rhythmically between systolic peaks (around 117 mm Hg) and diastolic troughs (around 77 mm Hg). A descending gray diagonal line represents the gradually deflating blood pressure cuff pressure, starting above 130 mm Hg and declining below 70 mm Hg. Two vertical dashed lines mark critical measurement points: the left line labeled “Systolic blood pressure (first sound heard)” indicates where the cuff pressure equals the systolic pressure and Korotkoff sounds first appear, while the right line labeled “Diastolic blood pressure (last sound heard)” shows where the cuff pressure equals diastolic pressure and the sounds disappear. The lower portion of the diagram shows a timeline of Korotkoff sounds as heard through a stethoscope, depicted as black waveform bursts that begin at the systolic measurement point, continue through the intermediate pressures as distinct tapping sounds, and cease at the diastolic measurement point. This visualization effectively demonstrates how the auscultatory method uses the appearance and disappearance of arterial sounds during cuff deflation to determine systolic and diastolic blood pressure values, with the sounds occurring only when cuff pressure falls between these two values and allows turbulent blood flow through the partially compressed artery. [Return to Figure 10.2.3]
Figure 10.2.4. This composite figure contains four graphs that illustrate key hemodynamic parameters as blood flows through different vessel types in the cardiovascular system, from elastic arteries through to venae cavae. Graph (a) shows vessel diameter in centimeters, depicting how individual vessel size decreases dramatically from elastic arteries (approximately 2.5 cm) through muscular arteries and arterioles to reach a minimum at capillaries (nearly 0 cm), then gradually increases through venules and veins to venae cavae (approximately 3 cm), with the curve colored red during the arterial decline and blue during the venous increase. Graph (b) displays total cross-sectional area in square centimeters, revealing a bell-shaped curve that starts low in elastic arteries (around 200 cm²), rises steeply through arterioles (around 1000 cm²) to peak dramatically at the capillaries (approximately 4800 cm²), then declines through venules back to low values in veins and venae cavae (around 300 cm²), with the curve transitioning from red through purple to blue. Graph (c) illustrates average blood pressure in millimeters of mercury, showing a steady decline from elastic arteries (approximately 100 mm Hg) through the arterial system with a sharp drop at arterioles (around 35 mm Hg), continuing to decrease through capillaries (approximately 20 mm Hg) and reaching the lowest values in veins and venae cavae (around 10 mm Hg), with the gradient shifting from red through purple to blue. Graph (d) presents velocity of blood flow in centimeters per second, demonstrating high velocity in elastic arteries (around 35 cm/sec), a dramatic decrease through arterioles to the lowest point at capillaries (less than 1 cm/sec), followed by a gradual increase through venules and veins to venae cavae (approximately 17 cm/sec), again colored from red through purple to blue. Together, these graphs illustrate the inverse relationship between total cross-sectional area and blood flow velocity, explain the dramatic pressure drop at arterioles due to high resistance, and demonstrate how the enormous combined cross-sectional area of capillaries allows for slow blood flow optimal for gas and nutrient exchange, while the cardiovascular system maintains continuity of flow throughout despite dramatic changes in vessel characteristics. [Return to Figure 10.2.4]
Figure 10.2.5. This figure compares normal and diseased arterial structure through both schematic diagrams and microscopic imaging. Panel (a) presents two cross-sectional diagrams of blood vessels side by side. The top diagram shows a normal artery with a wide, unobstructed lumen allowing free blood flow, clearly labeled layers including the tunica intima, tunica media, and tunica externa, and smooth internal surfaces. The bottom diagram illustrates an atherosclerotic artery where a large plaque has accumulated within the vessel wall, significantly narrowing the lumen and restricting blood flow, with the plaque shown as a yellowish deposit protruding into the vessel interior and the same three arterial layers labeled for comparison. Panel (b) displays an actual histological cross-section of an atherosclerotic artery stained in pink, revealing the microscopic structure of diseased vessel tissue. The image shows thick arterial walls with visible plaque accumulation appearing as lighter pink deposits within the vessel wall, a markedly narrowed and irregular lumen, and disrupted tissue architecture compared to healthy vessels. This comparison effectively demonstrates how atherosclerosis progressively narrows arteries by accumulating lipids, inflammatory cells, and fibrous material within the vessel wall, ultimately reducing blood flow and increasing risk of cardiovascular events such as heart attacks and strokes when these plaques rupture or completely occlude the vessel. [Return to Figure 10.2.5]
Figure 10.2.6. This side-by-side diagram illustrates the skeletal muscle pump mechanism that assists venous blood return to the heart. The left panel, labeled “Muscles relaxed, valves closed,” shows a longitudinal section of a vein (depicted in red) surrounded by relaxed skeletal muscle fibers (shown as vertical black lines). In this state, the vein maintains a relatively wide, uniform diameter with paired venous valves above and below appearing closed as curved leaflets meeting in the middle of the vessel lumen, preventing backflow of blood. The right panel, labeled “Muscles contracted, valve above muscle opens,” demonstrates the effect of muscle contraction on venous flow. Here, the skeletal muscle fibers are shown compressed and thickened, squeezing the vein and reducing its diameter in the middle section. This compression forces blood upward, causing the valve above the contracted muscle to open (shown with valve leaflets pressed against the vessel wall and blood flowing through), while the valve below remains closed to prevent backward flow. Small pockets of blood are visible below the lower closed valve. This mechanism, often called the skeletal muscle pump or musculovenous pump, is crucial for venous return, especially in the lower extremities where blood must travel against gravity back to the heart. The rhythmic contraction and relaxation of skeletal muscles during activities like walking effectively milks blood upward through the venous system, with the one-way valves ensuring unidirectional flow and preventing pooling of blood in the legs. [Return to Figure 10.2.6]
Report an Error
Did you find an error, typo, broken link, or other problem in the text? Please follow this link to the error reporting form to submit an error report to the authors.
