Chapter 5. The Nervous System and Nervous Tissue
5.5 The Action Potential
Learning Objectives
By the end of this section, you will be able to:
- Describe the components of the membrane that establish the resting membrane potential
- Describe the changes that occur to the membrane that result in the action potential
- Describe each step of an action potential. Explain how the action potential is generated and propagated
- Differentiate between absolute and relative refractory period. Describe what is responsible for each period
The functions of the nervous system—sensation, integration, and response—depend on the functions of the neurons underlying these pathways. To understand how neurons are able to communicate, it is necessary to describe the role of an excitable membrane in generating these signals. The basis of this process is the action potential. An action potential is a predictable change in membrane potential that occurs due to the open and closing of voltage gated ion channels on the cell membrane. Unlike graded potentials, action potentials propagate (travel) and have a specific size.
Electrically Active Cell Membranes
Most cells in the body make use of charged particles (ions) to create electrochemical charge across the cell membrane. In a future chapter, we will describe how muscle cells contract based on the movement of ions across the cell membrane. For skeletal muscles to contract, due to excitation–contraction coupling, they require input from a neuron. Both muscle and nerve cells make use of a cell membrane that is specialized for signal conduction to regulate ion movement between the extracellular fluid and cytosol.
As you learned in the chapter on cells, the cell membrane is primarily responsible for regulating what can cross the membrane. The cell membrane is a phospholipid bilayer, so only substances that can pass directly through the hydrophobic core can diffuse through unaided. Charged particles, which are hydrophilic, cannot pass through the cell membrane without assistance (Figure 5.5.1). Specific transmembrane channel proteins permit charged ions to move across the membrane. Several passive transport channels, as well as active transport pumps, are necessary to generate a transmembrane potential, and an action potential. Of special interest is the carrier protein referred to as the sodium-potassium pump that uses energy to move sodium ions (Na+) out of a cell and potassium ions (K+) into a cell, thus regulating ion concentration on both sides of the cell membrane.

The sodium/potassium pump requires energy in the form of adenosine triphosphate (ATP), so it is also referred to as an ATPase pump. As was explained in the cell chapter, the concentration of Na+ is higher outside the cell than inside, and the concentration of K+ is higher inside the cell than outside. Therefore, this pump is working against the concentration gradients for sodium and potassium ions, which is why it requires energy. The Na+/K+ ATPase pump maintains these important ion concentration gradients.
32NoKiA
The sodium-potassium pump, moves 3 sodium (Na+) out of the cell and 2 potassium (K+) into the cell using the ATP. 32NoKiA can help you remember this.
32NoKiA – 3 Na+ out
32NoKiA – 2 K+ in
32NoKiA – uses ATP
Ion channels are protein pores that allow specific charged particles to cross the membrane. Proteins are capable of spanning the cell membrane, including its hydrophobic core, and can interact with charged ions because of the varied properties of amino acids found within specific regions of the protein channel. Hydrophobic amino acids are found in the regions that are adjacent to the hydrocarbon tails of the phospholipids, where as hydrophilic amino acids are exposed to the fluid environments of the extracellular fluid and cytosol. Additionally, ions will interact with the hydrophilic amino acids, which will be selective for the charge of the ion. Channels for cations (positive ions) will have negatively charged side chains in the pore. Channels for anions (negative ions) will have positively charged side chains in the pore. The diameter of the channel’s pore also impacts the specific ions that can pass through. Some ion channels are selective for charge but not necessarily for size. These nonspecific channels allow cations—particularly Na+, K+, and Ca2+—to cross the membrane, but exclude anions.
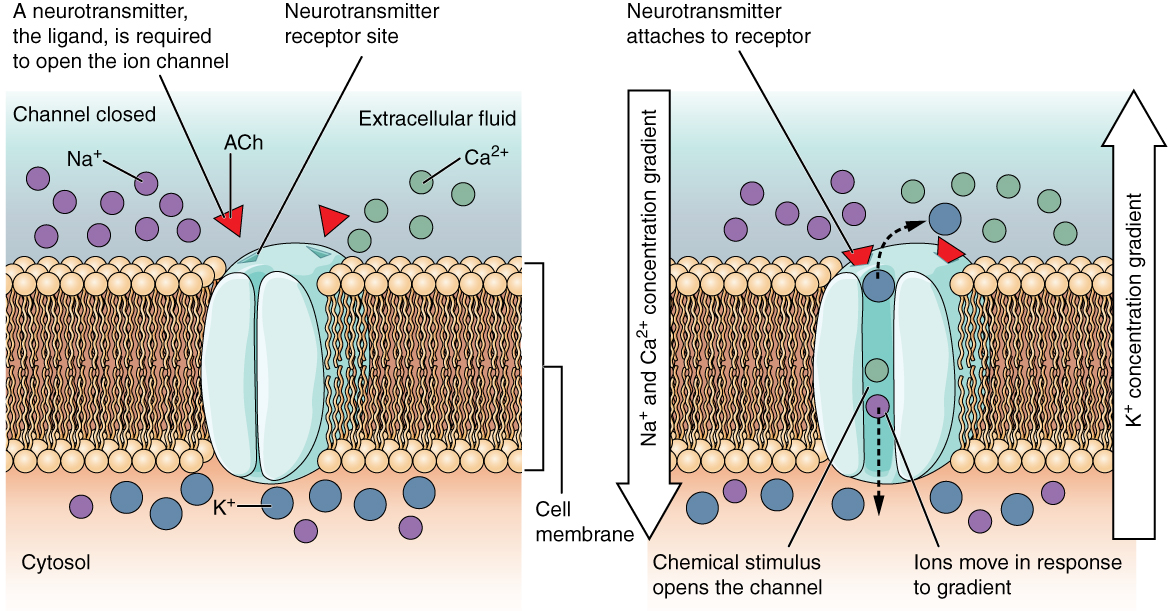
Some ion channels do not allow ions to freely diffuse across the membrane, but are gated instead. A ligand-gated channel opens because a molecule or ligand, such as a neurotransmitter, binds to the extracellular region of the channel (Figure 5.5.2).
A mechanically gated channel opens because of a physical distortion of the cell membrane. Many channels associated with the sense of touch are mechanically gated. For example, as pressure is applied to the skin, mechanically gated channels on the subcutaneous receptors open and allow ions to enter (Figure 5.5.3).
A voltage-gated channel is a channel that responds to changes in the electrical properties of the membrane in which it is embedded. Normally, the inner portion of the membrane is at a negative voltage. When that voltage becomes less negative and reaches a value specific to the channel, it opens and allows ions to cross the membrane (Figure 5.5.4).
A leak channel is randomly gated, meaning that it opens and closes at random, hence the reference to leaking. There is no actual event that opens the channel; instead, it has an intrinsic rate of switching between the open and closed states. Leak channels contribute to the resting transmembrane voltage of the excitable membrane (Figure 5.5.5).
The Membrane Potential
The membrane potential is a distribution of charge across the cell membrane, measured in millivolts (mV). The standard is to compare the inside of the cell relative to the outside, so the membrane potential is a value representing the charge on the intracellular side of the membrane (based on the outside being zero, relatively speaking; Figure 5.5.6).
There is typically an overall net neutral charge between the extracellular and intracellular environments of the neuron. However, a slight difference in charge occurs right at the membrane surface, both internally and externally. It is the difference in this very limited region that holds the power to generate electrical signals, including action potentials, in neurons and muscle cells.
When the cell is at rest, ions are distributed across the membrane in a very predictable way. The concentration of Na+ outside the cell is 10 times greater than the concentration inside. Also, the concentration of K+ inside the cell is greater than outside. The cytosol contains a high concentration of anions in the form of phosphate ions and negatively charged proteins. With the ions distributed across the membrane at these concentrations, the difference in charge is described as the resting membrane potential. The exact value measured for the resting membrane potential varies between cells, but -70 mV is a commonly reported value. This voltage would actually be much lower except for the contributions of some important proteins in the membrane. Leak channels allow Na+ to slowly move into the cell or K+ to slowly move out, and the Na+/K+ pump restores their concentration gradients across the membrane. This may appear to be a waste of energy, but each has a role in maintaining the membrane potential.
The Action Potential
Resting membrane potential describes the steady state of the cell, which is a dynamic process balancing ions leaking down their concentration gradient and ions being pumped back up their concentration gradient. Without any outside influence, the resting membrane potential will be maintained. To get an electrical signal started, the membrane potential has to become more positive.
This starts with the opening of voltage-gated Na+ channels in the neuron membrane. Because the concentration of Na+ is higher outside the cell than inside the cell by a factor of 10, ions will rush into the cell, driven by both the chemical and electrical gradients. Because sodium is a positively charged ion, as it enters the cell it will change the relative voltage immediately inside the cell membrane. The resting membrane potential is approximately -70 mV, so the sodium cation entering the cell will cause the membrane to become less negative. This is known as depolarization, meaning the membrane potential moves toward zero (becomes less polarized). The opening of voltage-gated Na+ channels trippers more voltage-gated Na+ to open. The concentration gradient for Na+ is so strong that it will continue to enter the cell even after the membrane potential has become zero, so that the voltage immediately around the pore then begins to become positive.
As the membrane potential reaches +30 mV, slower to open voltage-gated potassium channels are now opening in the membrane. An electrochemical gradient acts on K+, as well. As K+ starts to leave the cell, taking a positive charge with it, the membrane potential begins to move back toward its resting voltage. This is called repolarization, meaning that the membrane voltage moves back toward the -70 mV value of the resting membrane potential.
Repolarization returns the membrane potential to the -70 mV value of the resting potential but overshoots that value. Potassium ions reach equilibrium when the membrane voltage is below -70 mV, so a period of hyperpolarization occurs while the K+ channels are open. Those K+ channels are slightly delayed in closing, accounting for this short overshoot.
What has been described here is the action potential, which is presented as a graph of voltage over time in Figure 5.5.7. It is the electrical signal that nervous tissue generates for communication. The change in the membrane voltage from -70 mV at rest to +30 mV at the end of depolarization is a 100-mV change.
External Website

What happens across the membrane of an electrically active cell is a dynamic process that is hard to visualize with static images or through text descriptions. View this animation to learn more about this process.
The membrane potential will stay at the resting voltage until something changes. To begin an action potential, the membrane potential must change from the resting potential of approximately -70mV to the threshold voltage of -55mV. Once the cell reaches threshold, voltage-gated sodium channels open and being the predictable membrane potential changes describe above as an action potential. Any sub-threshold depolarization that does not change the membrane potential to -55 mV or higher will not reach threshold and thus will not result in an action potential. Also, any stimulus that depolarizes the membrane to -55 mV or beyond will cause a large number of channels to open and an action potential will be initiated.
Because of the predictable changes that occur once threshold is reached, the action potential is referred to as “all or none.” This means that either the action potential occurs and is repeated along the entire length of the neuron or no action potential occurs. A stronger stimulus, which might depolarize the membrane well past threshold, will not make a “bigger” action potential, hence all action potentials being the same size. Either the membrane reaches the threshold and everything occurs as described above, or the membrane does not reach the threshold and nothing else happens. All action potentials peak at the same voltage (+30 mV), so one action potential is not bigger than another. Stronger stimuli will initiate multiple action potentials more quickly, but the individual signals are not bigger.
As we have seen, the depolarization and repolarization of an action potential are dependent on two types of channels (the voltage-gated Na+ channel and the voltage-gated K+ channel). The voltage-gated Na+ channel actually has two gates. One is the activation gate, which opens when the membrane potential crosses -55 mV. The other gate is the inactivation gate, which closes after a specific period of time—on the order of a fraction of a millisecond. When a cell is at rest, the activation gate is closed and the inactivation gate is open. However, when the threshold is reached, the activation gate opens, allowing Na+ to rush into the cell. Timed with the peak of depolarization, the inactivation gate closes. During repolarization, no more sodium can enter the cell and voltage-gated Na+ can not be opened again for a short period of time. When the membrane potential passes -55 mV again, the activation gate closes. After that, the inactivation gate reopens, making the channel ready to start the whole process over again.
The voltage-gated K+ channel has only one gate, which is sensitive to a membrane voltage of -50 mV. However, it does not open as quickly as the voltage-gated Na+ channel does. It takes a fraction of a millisecond for the K+ channel to open once that voltage has been reached, which coincides exactly with when the Na+ flow peaks. So voltage-gated K+ channels open just as the voltage-gated Na+ channels are being inactivated. As the membrane potential repolarizes and the voltage passes -50 mV again, the K+ channels begin to close. Potassium continues to leave the cell for a short while and the membrane potential becomes more negative, resulting in the hyperpolarization overshoot. Then the K+ channels are closed and the membrane returns to the resting potential because of the ongoing activity of the leak channels and the Na+/K+ ATPase pump.
All of this takes place within approximately 2 milliseconds (Figure 5.5.8). While an action potential is in progress, another one cannot be initiated. That effect is referred to as the refractory period. There are two phases of the refractory period: the absolute refractory period and the relative refractory period. During the absolute refractory period, another action potential will not start. This is because of the inactivation gate of the voltage-gated Na+ channel. Once the Na+ channel is back to its resting conformation, a new action potential could be started during the hyperpolarization phase, but only by a stronger stimulus than the one that initiated the current action potential.
Propagation of the Action Potential
The action potential is initiated at the beginning of the axon, at what is called the initial segment (trigger zone). Rapid depolarization can take place here due to a high density of voltage-gated Na+ channels. Going down the length of the axon, the action potential is propagated because more voltage-gated Na+ channels are opened as the depolarization spreads. This spreading occurs because Na+ enters through the channel and moves along the inside of the cell membrane. As the Na+ moves, or flows, a short distance along the cell membrane, its positive charge depolarizes a little more of the cell membrane. As that depolarization spreads, new voltage-gated Na+ channels open and more ions rush into the cell, spreading the depolarization a little farther.
Because voltage-gated Na+ channels are inactivated at the peak of the depolarization, they cannot be opened again for a brief time (absolute refractory period). Because of this, positive ions spreading back toward previously opened channels has no effect. The action potential must propagate from the trigger zone toward the axon terminals. Often, action potentials are described as unidirectional for this reason.
Propagation, as described above, applies to unmyelinated axons. When myelination is present, the action potential propagates differently, and is optimized for the speed of signal conduction. Sodium ions that enter the cell at the trigger zone start to spread along the length of the axon segment, but there are no voltage-gated Na+ channels until the first node of Ranvier. Because there is not constant opening of these channels along the axon segment, the depolarization spreads at an optimal speed. The distance between nodes is the optimal distance to keep the membrane still depolarized above threshold at the next node. As Na+ spreads along the inside of the membrane of the axon segment, the charge starts to dissipate. If the node were any farther down the axon, that depolarization would have fallen off too much for voltage-gated Na+ channels to be activated at the next node of Ranvier. If the nodes were any closer together, the speed of propagation would be slower.

Propagation along an unmyelinated axon is referred to as continuous conduction; along the length of a myelinated axon it is referred to as saltatory conduction. Continuous conduction is slow because there are always voltage-gated Na+ channels opening and more and more Na+ is rushing into the cell. Saltatory conduction is faster because the action potential “jumps” from one node to the next (“saltare” meaning “to leap”), and the new influx of Na+ renews the depolarized membrane. Along with the myelination of the axon, the diameter of the axon can influence the speed of conduction. Much as water runs faster in a wide river than in a narrow creek, Na+-based depolarization spreads faster down a wide axon than down a narrow one. This concept is known as resistance and is generally true for electrical wires or plumbing, just as it is true for axons, although the specific conditions are different at the scales of electrons or ions versus water in a river.
Homeostatic Imbalances – Potassium Concentration
Glial cells, especially astrocytes, are responsible for maintaining the chemical environment of the CNS tissue. The concentrations of ions in the extracellular fluid are the basis for how the membrane potential is established and changes in electrochemical signaling. If the balance of ions is upset, drastic outcomes are possible.
Normally the concentration of K+ is higher inside the neuron than outside. After the repolarizing phase of the action potential, K+ leak channels and Na+/K+ pumps ensure that the ions return to their original locations. Following a stroke or other ischemic event, extracellular K+ levels are elevated. The astrocytes in the area are equipped to clear excess K+ to aid the pump. But when the level is far out of balance, the effects can be irreversible.
Astrocytes can become reactive in cases such as these, which impairs their ability to maintain the local chemical environment. The glial cells enlarge and their processes swell. They lose their K+ buffering ability and the function of the pump is affected, or even reversed. One of the early signs of cell disease is this “leaking” of sodium ions into the body cells. This sodium-potassium imbalance negatively affects the internal chemistry of cells, preventing them from functioning normally.
External Website

Visit HHMI’s Biointeractive site [New Tab] to see a virtual neurophysiology lab and to observe electrophysiological processes in the nervous system, where scientists directly measure the electrical signals produced by neurons. Often, the action potentials occur so rapidly that watching a screen to see them occur is not helpful. A speaker is powered by the signals recorded from a neuron, and it “pops” each time the neuron fires an action potential. These action potentials are firing so fast that it sounds like static on the radio. Electrophysiologists can recognize the patterns within that static to understand what is happening.
Section Review
The nervous system is characterized by electrical signals that are sent from one area to another. Whether those areas are close or very far apart, the signal must travel along an axon. The basis of the electrical signal is the controlled distribution of ions across the membrane. Transmembrane ion channels regulate when ions can move in or out of the cell, so that a precise signal is generated. This signal is the action potential which has a very characteristic shape based on voltage changes across the membrane in a given time period.
The membrane is normally at rest with established Na+ and K+ concentrations on either side. A stimulus will start the depolarization of the membrane, and voltage-gated channels will result in further depolarization followed by repolarization of the membrane. A slight overshoot of hyperpolarization marks the end of the action potential. While an action potential is in progress, another cannot be generated under the same conditions. While the voltage-gated Na+ channel is inactivated, absolutely no action potentials can be generated. Once that channel has returned to its resting state, a new action potential is possible, but it must be started by a relatively stronger stimulus to overcome the state of hyperpolarization.
The action potential travels down the axon as voltage-gated ion channels are opened by the spreading depolarization. In unmyelinated axons, this happens in a continuous fashion because there are voltage-gated channels throughout the membrane. In myelinated axons, propagation is described as saltatory because voltage-gated channels are only found at the nodes of Ranvier and the electrical events seem to “jump” from one node to the next. Saltatory conduction is faster than continuous conduction, meaning that myelinated axons propagate their signals faster. The diameter of the axon also makes a difference as ions diffusing within the cell have less resistance in a wider space.
Review Questions
Critical Thinking Questions
Glossary
- absolute refractory period
- time during an action period when another action potential cannot be generated because the voltage-gated Na+ channel is inactivated
- activation gate
- part of the voltage-gated Na+ channel that opens when the membrane voltage reaches threshold
- continuous conduction
- slow propagation of an action potential along an unmyelinated axon owing to voltage-gated Na+ channels located along the entire length of the cell membrane
- depolarization
- change in a cell membrane potential from rest toward zero
- excitable membrane
- cell membrane that regulates the movement of ions so that an electrical signal can be generated
- gated
- property of a channel that determines how it opens under specific conditions, such as voltage change or physical deformation
- inactivation gate
- part of a voltage-gated Na+ channel that closes when the membrane potential reaches +30 mV
- ionotropic receptor
- neurotransmitter receptor that acts as an ion channel gate and opens by the binding of the neurotransmitter
- leakage channel
- ion channel that opens randomly and is not gated to a specific event, also known as a non-gated channel
- ligand-gated channels
- another name for an ionotropic receptor for which a neurotransmitter is the ligand
- mechanically gated channel
- ion channel that opens when a physical event directly affects the structure of the protein
- membrane potential
- distribution of charge across the cell membrane, based on the charges of ions
- relative refractory period
- time during the refractory period when a new action potential can only be initiated by a stronger stimulus than the current action potential because voltage-gated K+ channels are not closed
- repolarization
- return of the membrane potential to its normally negative voltage at the end of the action potential
- resting membrane potential
- the difference in voltage measured across a cell membrane under steady-state conditions, typically -70 mV
- saltatory conduction
- quick propagation of the action potential along a myelinated axon owing to voltage-gated Na+ channels being present only at the nodes of Ranvier
- voltage-gated channel
- ion channel that opens because of a change in the charge distributed across the membrane where it is located
Glossary Flashcards
This work, Human Physiology, is adapted from Anatomy & Physiology by OpenStax, licensed under CC BY. This edition, with revised content and artwork, is licensed under CC BY-SA except where otherwise noted.
Images from Anatomy & Physiology by OpenStax are licensed under CC BY except where otherwise noted.
Access the original for free at OpenStax.
Image Descriptions
Figure 5.5.1 This diagram illustrates a cross-section of a cell membrane showing its phospholipid bilayer structure and various embedded proteins. The membrane separates the extracellular fluid (light blue region at top) from the cytosol (peach region at bottom). The phospholipid bilayer consists of two layers with tan circular heads facing the aqueous environments and wavy brown tails forming a hydrophobic core in the middle. Several large, blocky light blue proteins are embedded in or associated with the membrane. Integral proteins are embedded between the phospholipids, with transmembrane proteins extending completely through both phospholipid layers, projecting into both the cytosol and extracellular fluid. A smaller integral protein only extends into the inner phospholipid layer with its end projecting into the cytosol, making it not a transmembrane protein. One peripheral protein (not embedded in the bilayer) is shown attached to the outside surface of another protein on the extracellular fluid side. A channel protein is prominently displayed as a cylinder-shaped structure with a hollow internal tube labeled as the “pore” that passes through the membrane. The sides of this channel protein can bulge inward to open or close the pore, controlling the passage of ions and molecules. This diagram demonstrates how the cell membrane’s diverse protein structures enable selective transport and communication across the membrane barrier [Return to Figure 5.5.1]
Figure 5.5.2 This two-panel diagram illustrates how a ligand-gated ion channel operates in response to neurotransmitter binding. Both panels show a cross-section of the phospholipid bilayer cell membrane separating the extracellular fluid (light blue, top) from the cytosol (peach, bottom). The left panel shows the closed channel state. In the extracellular fluid, there are large numbers of purple sodium ions (Na⁺) and green calcium ions (Ca²⁺), along with two red ACh (acetylcholine) molecules floating nearby. Within the cytosol, there are large numbers of blue potassium ions (K⁺) but only a few sodium ions. A light blue channel protein spans the membrane with its pore closed. Red arrows indicate that “a neurotransmitter, the ligand, is required to open the ion channel” and point to the neurotransmitter receptor site on the extracellular surface of the channel protein, which matches the shape of the ACh molecules. The right panel shows the open channel state after “neurotransmitter attaches to receptor.” The two ACh molecules have bound to the receptor sites on the channel protein (indicated by red arrows and darker markers), causing the channel to open. The large vertical arrow on the right indicates the overall concentration gradient direction. Dotted arrows show ions moving through the open pore: sodium and calcium ions diffuse down their concentration gradients from the extracellular fluid into the cytosol (labeled “ions move in response to gradient”), while potassium ions diffuse in the opposite direction out of the cell into the extracellular fluid. The caption notes these ion movements occur along their respective concentration gradients, with the label “Na⁺ and Ca²⁺ concentration gradient” and “K⁺ concentration gradient” indicating the driving forces. [Return to Figure 5.5.2]
Figure 5.5.3 This two-panel diagram illustrates how a mechanically gated ion channel operates in response to physical stimuli. Both panels show a cross-section of the phospholipid bilayer cell membrane separating the extracellular fluid (light blue, top) from the cytosol (peach, bottom). The left panel shows the closed channel state labeled “mechanically gated channel closed.” A light blue channel protein spans the membrane with a cap-like structure on the extracellular side that resembles a trash can lid, closed over the channel opening. There are large numbers of purple sodium ions (Na⁺) in the extracellular fluid but only a few in the cytosol, while green calcium ions (Ca²⁺) are abundant in the cytosol but sparse in the extracellular fluid. The right panel shows the open channel state labeled “mechanically gated channel open.” When a mechanical change occurs in the surrounding tissue, such as pressure or stretch (indicated by a curved arrow pressing down on the cap), the lid tilts to one side and physically opens the channel pore. Dotted arrows show ions moving through the open channel down their respective concentration gradients: purple sodium ions flow from the extracellular fluid into the cytosol (indicated by “Na⁺ concentration gradient” arrow on left), while green calcium ions simultaneously move from the cytosol into the extracellular fluid (indicated by “Ca²⁺ concentration gradient” arrow on right). This demonstrates how mechanical forces directly gate these channels, allowing bidirectional ion flow based on concentration gradients [Return to Figure 5.5.3]
Figure 5.5.4 This two-panel diagram illustrates how a voltage-gated ion channel operates in response to membrane potential changes. Both panels show the channel protein embedded in the phospholipid bilayer separating the extracellular fluid (top) from the cytosol (bottom). The left panel shows the closed state at -70 mV (resting potential). The channel contains a sphere-shaped gate attached to a filament on the cytosolic side that occludes the pore. Several dark blue ions are present in the cytosol, with only one in the extracellular fluid. The right panel shows the open state at -50 mV (depolarized). The voltage change causes the sphere gate to move aside, no longer blocking the channel. A dotted arrow shows one ion moving through the open pore from the cytosol into the extracellular fluid, down its concentration gradient (indicated by the vertical arrow labeled “concentration gradient”). This demonstrates how voltage-gated channels sense membrane potential changes through their voltage-sensitive structures and selectively allow ions to pass when the appropriate voltage threshold is reached. [Return to Figure 5.5.4]
Figure 5.5.5 This two-panel diagram illustrates how leak channels operate in the cell membrane by opening and closing randomly. Both panels show a cross-section of the phospholipid bilayer separating the extracellular fluid (light blue, top) from the cytosol (peach, bottom), with dark blue ions distributed in both regions. The left panel shows the closed state labeled “leakage channel closed.” A simple cylindrical light blue channel protein spans the membrane with its pore closed at the top, shown as a teal oval blocking the opening. One dark blue ion floats in the extracellular fluid above the closed channel, while several ions are present in the cytosol below, with one specifically labeled “ions.” The right panel shows the open state labeled “leakage channel randomly opens.” The channel pore is now open, and the blocking structure has moved aside (shown in peachy-orange at the cytosolic end). Dotted arrows show dark blue ions moving through the open channel in both directions: from the extracellular fluid down into the cytosol and from the cytosol out into the extracellular fluid, following their concentration gradients (indicated by the vertical “concentration gradient” arrow on the right). This demonstrates that leak channels open and close randomly without requiring specific stimuli, allowing ions to pass through when open and contributing to the resting membrane potential by permitting constant ion flow across the membrane. [Return to Figure 5.5.5]
Figure 5.5.6 This diagram illustrates the experimental setup for measuring transmembrane voltage across a cell membrane using a voltmeter. The cell membrane is shown as a phospholipid bilayer with tan circular heads and wavy pink tails, separating the extracellular fluid (light blue, top) from the cytosol (peach, bottom). Plus signs (+) are arranged along the outer surface of the membrane in the extracellular fluid, while minus signs (−) line the inner surface in the cytosol, representing the charge distribution that creates the membrane potential. Two electrodes connect to a voltmeter displayed at the top. On the left, a gray reference electrode is positioned outside the cell in the extracellular fluid. On the right, a red recording microelectrode penetrates through the membrane into the cytosol. The voltmeter shows a semicircular gauge marked with voltage values: 0 mV at the top center, −70 mV on the left, and +70 mV on the right. A red needle points to approximately −70 mV, indicating the resting membrane potential. By comparing the charge measured by these two electrodes, the transmembrane voltage is determined, with the value conventionally expressed for the cytosol relative to the outside environment. [Return to Figure 5.5.6]
Figure 5.5.7 This graph plots membrane potential in millivolts (mV) on the vertical axis, ranging from -70 to +30 mV, against time on the horizontal axis, illustrating the phases of an action potential. The yellow plot line begins steady at the resting potential of -70 mV, then increases to approximately -55 mV (the purple dashed threshold line). After crossing threshold, the line rapidly increases during the depolarization phase, peaking at +30 mV. The plot line then quickly drops back toward -70 mV during the repolarization phase. The line continues dropping below -70 mV to approximately -85 mV, creating the hyperpolarization phase where the membrane potential becomes more negative than resting. Finally, the plot line gradually increases back to -70 mV, returning to the resting state. This graph demonstrates the characteristic phases of an action potential: depolarization (rapid rise), repolarization (rapid fall), hyperpolarization (dip below resting), and return to rest. [Return to Figure 5.5.7]
Figure 5.5.8 This graph plots membrane potential in millivolts (mV) on the vertical axis, ranging from -70 to +30 mV, against time on the horizontal axis, with numbered labels identifying six key stages of an action potential. The yellow plot line shows these sequential events: (1) “At rest” – the membrane voltage is steady at -70 mV. (2) “Stimulus applied” – an external stimulus (indicated by an upward arrow) causes the plot line to begin increasing toward the purple dashed threshold line at -55 mV. (3) “Voltage rises” – after crossing threshold, the membrane voltage rapidly increases during depolarization, peaking at +30 mV. (4) “Voltage falls” – the membrane voltage quickly drops back down through 0 mV toward -70 mV during repolarization. (5) “End of action potential” – the plot line continues dropping below -70 mV to approximately -85 mV, creating hyperpolarization where the membrane becomes more negative than resting potential. (6) “Return to rest” – the voltage gradually increases back to -70 mV, restoring the resting state and completing the action potential cycle [Return to Figure 5.5.8]
Figure 5.5.9 This diagram illustrates how action potentials propagate along a myelinated nerve fiber through saltatory conduction. The lower left shows a complete neuron with its soma (containing the pink nucleus and green organelles), dendrites, and axon extending from the axon hillock. The axon is wrapped in myelin sheaths produced by Schwann cells, whose nuclei are visible as pink ovals within the yellowish myelin segments. Red curved arrows indicate the “saltatory conduction of action potential” jumping between unmyelinated sections. The upper right magnified view shows the molecular mechanism at the Nodes of Ranvier, the unmyelinated gaps between myelin segments. In the yellow myelinated sections labeled “closed ion channels,” pink sodium (Na⁺) channels remain closed with minus signs (—) indicating the negative interior charge. At the Nodes of Ranvier labeled “open ion channels,” pink sodium channels open with plus signs (+++) showing depolarization. Red arrows with vertical lines show sodium ions flowing into the cell through these open channels, causing membrane depolarization and generating the action potential. The diagram on the far right shows the action potential reaching the synapse where neurotransmitters are released. This saltatory conduction allows rapid signal transmission by having the action potential jump from node to node rather than traveling continuously along the entire axon length. [Return to Figure 5.5.9]
Report an Error
Did you find an error, typo, broken link, or other problem in the text? Please follow this link to the error reporting form to submit an error report to the authors.
